Skip to main content
Macroeconomics
나의 코스
배우기
시험 준비
AI 튜터
학습 가이드
플래시카드
탐험해 보세요
앱을 사용해 보세요
나의 코스
배우기
시험 준비
AI 튜터
학습 가이드
플래시카드
탐험해 보세요
앱을 사용해 보세요
뒤로
The Basics of Demand definitions
카드를 뒤집기 위해 탭할 수 있습니다.
Demand
카드를 뒤집기 위해 탭할 수 있습니다.
👆
Demand
Represents the total amount consumers are willing and able to buy at various prices, shown as a curve or schedule.
진행 상황 추적
컨트롤 버튼이 '내비게이션' 모드로 변경되었습니다.
1/12
관련 플래시카드
관련 실천
추천 영상
The Basics of Demand quiz #1
The Basics of Demand
10 용어
The Basics of Demand
3. Supply and Demand
10 문제점
주제
Individual Demand and Market Demand
3. Supply and Demand
10 문제점
주제
3. Supply and Demand - Part 1 of 2
11 주제
15 문제점
장
3. Supply and Demand - Part 2 of 2
1 주제
3 문제점
장
VideoThumbView.guidedCourse
06:02
The Basics of Demand
594
views
31
rank
이 집합의 용어 (12)
하이드의 정의
Demand
Represents the total amount consumers are willing and able to buy at various prices, shown as a curve or schedule.
Quantity Demanded
Refers to the specific amount consumers would purchase at a particular price, represented by a single point.
Demand Schedule
A table listing different prices and the corresponding amounts consumers would buy at each price.
Demand Curve
A graphical representation showing the relationship between price and the amount consumers would buy at each price.
Law of Demand
States that as price rises, the amount consumers buy falls, and as price falls, the amount rises.
Price-Quantity Graph
A chart with price on the vertical axis and amount on the horizontal axis, used to plot consumer behavior.
Substitution Effect
Explains how consumers switch to alternatives when a product's price increases, reducing the amount bought.
Income Effect
Describes how a price change alters consumers' purchasing power, affecting the amount they buy.
Perfectly Competitive Market
A setting where many buyers and sellers interact, and no single participant can influence the price.
Widget
A generic, imaginary product used in examples to illustrate economic concepts without real-world bias.
Abbreviation
A shortened form, such as 'D' for demand and 'Qd' for the amount bought at a specific price.
Downward Slope
Describes the typical shape of the curve showing that as price decreases, the amount bought increases.
 뒤로뒤로
뒤로뒤로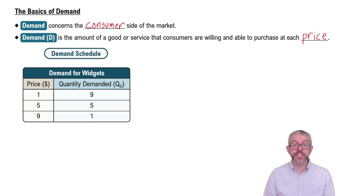
 06:02
06:02