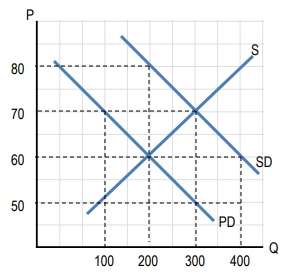
Use this diagram to answer the following questions. PD is private demand. SD is social demand. The figure above contains:
A
A positive externality
B
A negative externality
C
Both positive and negative externalities
D
No externalities
0 댓글
검증된 단계별 안내
1
Identify the curves in the graph: The graph shows two supply curves (S and SD) and two demand curves (PD and the implicit demand curve).
Understand the concept of externalities: Externalities occur when a third party is affected by the production or consumption of a good, either positively or negatively.
Analyze the supply curves: The curve labeled 'S' represents the private supply curve, while 'SD' represents the social supply curve, which includes external costs or benefits.
Determine the type of externality: If the social supply curve (SD) is to the right of the private supply curve (S), it indicates a positive externality, as the social cost is lower than the private cost.
Conclude based on the graph: Since the social supply curve (SD) is to the right of the private supply curve (S), the graph represents a positive externality.


 검증된 단계별 안내

