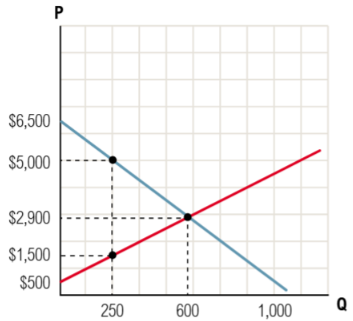
Use the graph for Thingamabobs above. If the price were to decrease to \$1500 per Thingamabob, what is the change to producer surplus?
A
Decreases by \$595,000
B
Decreases by \$297,500
C
Increases by \$595,000
D
Increases by \$297,500
0 댓글
검증된 단계별 안내
1
Identify the initial equilibrium price and quantity from the graph. The initial equilibrium is where the supply and demand curves intersect, which is at a price of \$2,900 and a quantity of 600 units.
Determine the new price given in the problem, which is \$1,500 per Thingamabob, and find the corresponding quantity supplied at this price from the supply curve. According to the graph, at \$1,500, the quantity supplied is 250 units.
Calculate the initial producer surplus. Producer surplus is the area above the supply curve and below the price line, up to the quantity sold. Initially, it is the area of the triangle formed by the price axis, the supply curve, and the price line at \$2,900 for 600 units.
Calculate the new producer surplus after the price decreases to \$1,500. This is the area above the supply curve and below the new price line at \$1,500, up to the new quantity supplied of 250 units.
Find the change in producer surplus by subtracting the new producer surplus from the initial producer surplus. This will show whether the producer surplus increases or decreases and by how much.


 검증된 단계별 안내

