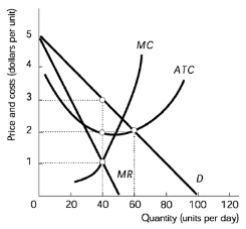
In the above figure, the monopolistically competitive firm earns an economic profit of:
A
\$0
B
Between \$0 and \$50 per day
C
Between \$50 and \$100 per day
D
More than \$100 per day
0 댓글
검증된 단계별 안내
1
Identify the quantity where the firm maximizes its profit. This occurs where the marginal cost (MC) curve intersects the marginal revenue (MR) curve. From the graph, this intersection happens at a quantity of 40 units.
Determine the price at which the firm sells this quantity. To find this, go up vertically from the quantity of 40 units to the demand curve (D) and then horizontally to the price axis. The price is approximately \$3 per unit.
Find the average total cost (ATC) at the profit-maximizing quantity. Go up vertically from the quantity of 40 units to the ATC curve and then horizontally to the price axis. The ATC is approximately \$2 per unit.
Calculate the economic profit per unit by subtracting the ATC from the price: Economic Profit per Unit = Price - ATC = \$3 - \$2 = \$1.
Calculate the total economic profit by multiplying the economic profit per unit by the quantity: Total Economic Profit = Economic Profit per Unit * Quantity = \$1 * 40 = \$40. This places the profit between \$0 and \$50 per day.


 검증된 단계별 안내

