Skip to main content
Microeconomics
나의 코스
배우기
시험 준비
AI 튜터
학습 가이드
플래시카드
탐험해 보세요
앱을 사용해 보세요
나의 코스
배우기
시험 준비
AI 튜터
학습 가이드
플래시카드
탐험해 보세요
앱을 사용해 보세요
뒤로
AD-AS Model: Equilibrium in the Short Run and Long Run definitions
카드를 뒤집기 위해 탭할 수 있습니다.
Aggregate Demand
카드를 뒤집기 위해 탭할 수 있습니다.
👆
Aggregate Demand
Represents the total spending on goods and services at various price levels within an economy.
진행 상황 추적
컨트롤 버튼이 '내비게이션' 모드로 변경되었습니다.
1/14
관련 플래시카드
추천 영상
AD-AS Model: Equilibrium in the Short Run and Long Run quiz
AD-AS Model: Equilibrium in the Short Run and Long Run
15 용어
VideoThumbView.guidedCourse
02:35
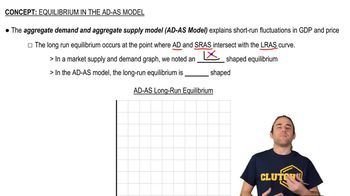
Short Run Equilibrium in the AD-AS Model
5
views
VideoThumbView.guidedCourse
02:28
Long Run Equilibrium in the AD-AS Model
5
views
이 집합의 용어 (14)
하이드의 정의
Aggregate Demand
Represents the total spending on goods and services at various price levels within an economy.
Short-Run Aggregate Supply
Shows the relationship between production and price level when some input prices are fixed.
Long-Run Aggregate Supply
Depicts the economy's maximum sustainable output when all prices are flexible.
Equilibrium Price Level
The point where the market's aggregate demand and aggregate supply curves intersect, setting overall prices.
Real GDP
Measures the value of all goods and services produced, adjusted for inflation, reflecting true economic output.
Long-Run Equilibrium
Occurs where aggregate demand, short-run aggregate supply, and long-run aggregate supply all meet.
Short-Run Equilibrium
The intersection of aggregate demand and short-run aggregate supply, determining temporary output and prices.
Economic Fluctuations
Variations in output and price level caused by shifts in aggregate demand or supply.
Market-Clearing Price
The price at which the quantity demanded equals the quantity supplied in the aggregate market.
Price Level
Represents the average of current prices across the entire spectrum of goods and services in the economy.
Output
The total amount of goods and services produced within an economy, often measured by real GDP.
Inflation
A sustained increase in the general price level, often resulting from shifts in aggregate demand or supply.
Graph
A visual representation used to illustrate the relationships between aggregate demand, supply, and equilibrium.
Intersection
The point where two or more curves meet, indicating equilibrium in the AD-AS model.
 뒤로뒤로
뒤로뒤로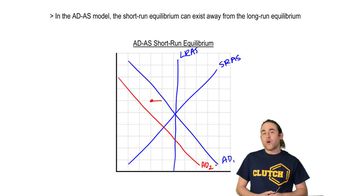
 02:35
02:35