Skip to main content
Microeconomics
나의 코스
배우기
시험 준비
AI 튜터
학습 가이드
플래시카드
탐험해 보세요
앱을 사용해 보세요
나의 코스
배우기
시험 준비
AI 튜터
학습 가이드
플래시카드
탐험해 보세요
앱을 사용해 보세요
뒤로
Perfect Competition Profit on the Graph definitions
카드를 뒤집기 위해 탭할 수 있습니다.
Perfect Competition
카드를 뒤집기 위해 탭할 수 있습니다.
👆
Perfect Competition
A market structure where firms face a flat demand curve and price equals both average revenue and marginal revenue.
진행 상황 추적
컨트롤 버튼이 '내비게이션' 모드로 변경되었습니다.
1/15
관련 플래시카드
관련 실천
추천 영상
Perfect Competition Profit on the Graph quiz
Perfect Competition Profit on the Graph
15 용어
Perfect Competition Profit on the Graph
11. Perfect Competition
10 문제점
주제
Short Run Shutdown Decision
11. Perfect Competition
10 문제점
주제
11. Perfect Competition
11 주제
15 문제점
장
VideoThumbView.guidedCourse
13:25
Profit on the Graph in Perfect Competition
4359
views
48
rank
이 집합의 용어 (15)
하이드의 정의
Perfect Competition
A market structure where firms face a flat demand curve and price equals both average revenue and marginal revenue.
Profit Maximizing Quantity
The output level where marginal revenue equals marginal cost, ensuring highest possible profit or lowest possible loss.
Marginal Revenue
The additional income received from selling one more unit, equal to price in perfect competition.
Marginal Cost
The extra expense incurred from producing one additional unit, used to determine optimal output.
Demand Curve
A graphical representation showing the relationship between price and quantity demanded, flat for firms in perfect competition.
Average Revenue
The revenue per unit sold, identical to price in perfect competition.
Average Total Cost
The total cost per unit at a given output, crucial for calculating profit or loss.
Profit
The area on a graph where price exceeds average total cost at the profit maximizing quantity.
Loss
The area on a graph where average total cost surpasses price at the profit maximizing quantity.
Break Even
A situation where price equals average total cost, resulting in zero profit or loss.
Cost Curve
A graphical line representing costs at various output levels, including marginal and average total cost.
Price
The market value per unit, equal to marginal revenue and average revenue in perfect competition.
Quantity Axis
The horizontal axis on a graph indicating the number of units produced or sold.
Profit Formula
A calculation using (Price - Average Total Cost) multiplied by quantity to determine total profit or loss.
Loss Minimizing Point
The output level where marginal revenue equals marginal cost, minimizing losses when costs exceed revenues.
 뒤로뒤로
뒤로뒤로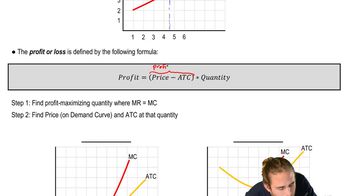
 13:25
13:25