Skip to main content
Microeconomics
나의 코스
배우기
시험 준비
AI 튜터
학습 가이드
플래시카드
탐험해 보세요
앱을 사용해 보세요
나의 코스
배우기
시험 준비
AI 튜터
학습 가이드
플래시카드
탐험해 보세요
앱을 사용해 보세요
뒤로
Effects of Surplus definitions
카드를 뒤집기 위해 탭할 수 있습니다.
Surplus
카드를 뒤집기 위해 탭할 수 있습니다.
👆
Surplus
Occurs when the market price exceeds equilibrium, causing quantity supplied to surpass quantity demanded and resulting in excess supply.
진행 상황 추적
컨트롤 버튼이 '내비게이션' 모드로 변경되었습니다.
1/14
관련 플래시카드
관련 실천
추천 영상
Effects of Surplus quiz #1
Effects of Surplus
15 용어
Effects of Surplus
3. The Market Forces of Supply and Demand
10 문제점
주제
Effects of Shortage
3. The Market Forces of Supply and Demand
10 문제점
주제
3. The Market Forces of Supply and Demand - Part 1 of 2
11 주제
15 문제점
장
3. The Market Forces of Supply and Demand - Part 2 of 2
1 주제
3 문제점
장
VideoThumbView.guidedCourse
03:05
Surplus
3367
views
50
rank
이 집합의 용어 (14)
하이드의 정의
Surplus
Occurs when the market price exceeds equilibrium, causing quantity supplied to surpass quantity demanded and resulting in excess supply.
Equilibrium Price
The price at which the demand and supply curves intersect, ensuring quantity supplied equals quantity demanded.
Quantity Supplied
The amount producers are willing to offer at a specific price, shown as a point on the supply curve.
Quantity Demanded
The amount consumers are willing to purchase at a specific price, represented as a point on the demand curve.
Excess Supply
The portion of goods remaining unsold when quantity supplied is greater than quantity demanded at a given price.
Demand Curve
A graphical representation showing the relationship between price and the quantity consumers wish to buy.
Supply Curve
A graph illustrating how much producers are willing to sell at various prices.
Price Axis
The vertical axis on a market graph, indicating different price levels.
Quantity Axis
The horizontal axis on a market graph, displaying the number of units bought or sold.
Market Price
The current price at which goods are traded, which may differ from equilibrium and cause surplus or shortage.
High Price
A price set above equilibrium, leading to reduced demand and increased supply.
Graph
A visual tool used to illustrate relationships between price and quantity, including surplus areas.
Intersection
The point where demand and supply curves meet, indicating equilibrium conditions.
Area of Surplus
The region on a graph between the quantity supplied and quantity demanded at a price above equilibrium.
 뒤로뒤로
뒤로뒤로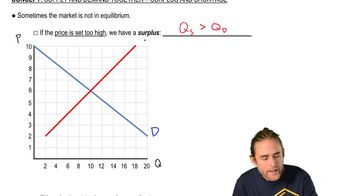
 03:05
03:05