Skip to main content
Microeconomics
나의 코스
배우기
시험 준비
AI 튜터
학습 가이드
플래시카드
탐험해 보세요
앱을 사용해 보세요
나의 코스
배우기
시험 준비
AI 튜터
학습 가이드
플래시카드
탐험해 보세요
앱을 사용해 보세요
뒤로
Graphs of Two Variables definitions
카드를 뒤집기 위해 탭할 수 있습니다.
X-axis
카드를 뒤집기 위해 탭할 수 있습니다.
👆
X-axis
Horizontal line on a graph representing quantity, typically increasing from left to right in economic diagrams.
진행 상황 추적
컨트롤 버튼이 '내비게이션' 모드로 변경되었습니다.
1/15
관련 플래시카드
관련 실천
추천 영상
Graphs of Two Variables quiz #1
Graphs of Two Variables
10 용어
Graphs of Two Variables
1. Reading and Understanding Graphs
10 문제점
주제
Relationships between Variables
1. Reading and Understanding Graphs
10 문제점
주제
1. Reading and Understanding Graphs
9 주제
15 문제점
장
VideoThumbView.guidedCourse
04:34
Plotting Points on a Graph
5681
views
103
rank
이 집합의 용어 (15)
하이드의 정의
X-axis
Horizontal line on a graph representing quantity, typically increasing from left to right in economic diagrams.
Y-axis
Vertical line on a graph representing price, usually increasing upward and used for economic conventions.
Quantity
Numerical value plotted along the horizontal axis, indicating the amount of a good or service.
Price
Numerical value plotted along the vertical axis, indicating the monetary value of a good or service.
Demand Schedule
Table listing various prices and corresponding quantities demanded, used as a basis for plotting points.
Point
Specific location on a graph where a price and quantity pair intersect, often labeled for clarity.
Pair
Combination of two values, one from each axis, used to determine a unique position on a graph.
Intersection
Spot on a graph where values from the horizontal and vertical axes meet, marking a plotted data point.
Label
Identifier, such as a letter or color, assigned to a plotted point for easy reference and tracking.
Convention
Standard practice in economics for assigning price to the vertical axis and quantity to the horizontal axis.
Graph
Visual representation with axes, used to display relationships between two variables like price and quantity.
Axis
Reference line, either horizontal or vertical, used to organize and scale values in a two-variable graph.
Vertical Axis
Line running upward on a graph, typically reserved for price in economic diagrams.
Horizontal Axis
Line running left to right on a graph, typically reserved for quantity in economic diagrams.
Plot
Process of marking a point at the intersection of two values from the axes, visually representing data.
 뒤로뒤로
뒤로뒤로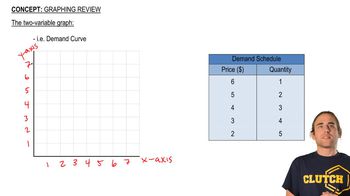
 04:34
04:34