Skip to main content
Microeconomics
나의 코스
배우기
시험 준비
AI 튜터
학습 가이드
플래시카드
탐험해 보세요
앱을 사용해 보세요
나의 코스
배우기
시험 준비
AI 튜터
학습 가이드
플래시카드
탐험해 보세요
앱을 사용해 보세요
뒤로
Price Elasticity of Demand on a Graph definitions
카드를 뒤집기 위해 탭할 수 있습니다.
Perfectly Elastic Demand
카드를 뒤집기 위해 탭할 수 있습니다.
👆
Perfectly Elastic Demand
A horizontal line on a graph, indicating infinite responsiveness; quantity demanded changes instantly with any price change.
진행 상황 추적
컨트롤 버튼이 '내비게이션' 모드로 변경되었습니다.
1/15
관련 플래시카드
관련 실천
추천 영상
Price Elasticity of Demand on a Graph quiz #1
Price Elasticity of Demand on a Graph
18 용어
Price Elasticity of Demand on a Graph
4. Elasticity
10 문제점
주제
Determinants of Price Elasticity of Demand
4. Elasticity
9 문제점
주제
4. Elasticity
11 주제
15 문제점
장
VideoThumbView.guidedCourse
11:34
Price Elasticity of Demand on a Graph
4402
views
100
rank
2
comments
이 집합의 용어 (15)
하이드의 정의
Perfectly Elastic Demand
A horizontal line on a graph, indicating infinite responsiveness; quantity demanded changes instantly with any price change.
Perfectly Inelastic Demand
A vertical line on a graph, showing zero responsiveness; quantity demanded remains constant regardless of price.
Elastic Demand
A shallow curve where small price changes cause large shifts in quantity demanded, typical for goods with close substitutes.
Inelastic Demand
A steep curve where quantity demanded changes minimally despite significant price shifts, common for necessities.
Unit Elastic Demand
A curve where percentage changes in price and quantity demanded are equal, often seen in products like clothing.
Demand Curve
A graphical representation showing the relationship between price and quantity demanded, shaped by elasticity.
Price Elasticity
A measure of how much quantity demanded responds to price changes, ranging from zero to infinity.
Necessity
A product for which demand remains stable even with price increases, such as gasoline or life-saving drugs.
Substitute
An alternative product that consumers switch to when the price of another good rises, like chicken for beef.
Percentage Change
A proportional shift in price or quantity, used to compare responsiveness in elasticity calculations.
Competitive Market
A market where many sellers offer identical products, leading to perfectly elastic demand for individual suppliers.
Quantity Demanded
The amount of a product consumers are willing to purchase at a specific price, influenced by elasticity.
Horizontal Line
A graphical feature representing infinite elasticity, where price remains constant and quantity varies.
Vertical Line
A graphical feature representing zero elasticity, where quantity remains constant and price varies.
Steep Curve
A graph shape indicating low responsiveness; large price changes result in small quantity changes.
 뒤로뒤로
뒤로뒤로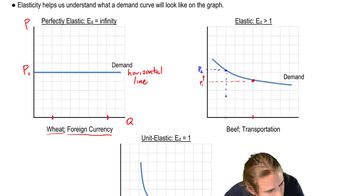
 11:34
11:34