Skip to main content
Microeconomics
나의 코스
배우기
시험 준비
AI 튜터
학습 가이드
플래시카드
탐험해 보세요
앱을 사용해 보세요
나의 코스
배우기
시험 준비
AI 튜터
학습 가이드
플래시카드
탐험해 보세요
앱을 사용해 보세요
뒤로
Shifts in the Demand Curve definitions
카드를 뒤집기 위해 탭할 수 있습니다.
Demand Curve
카드를 뒤집기 위해 탭할 수 있습니다.
👆
Demand Curve
A graphical representation showing the relationship between price and the quantity consumers are willing to buy at each price.
진행 상황 추적
컨트롤 버튼이 '내비게이션' 모드로 변경되었습니다.
1/15
관련 플래시카드
관련 실천
추천 영상
Shifts in the Demand Curve quiz #1
Shifts in the Demand Curve
38 용어
Shifts in the Demand Curve quiz #2
Shifts in the Demand Curve
34 용어
Shifts in the Demand Curve
3. The Market Forces of Supply and Demand
10 문제점
주제
Movement Along a Demand Curve
3. The Market Forces of Supply and Demand
8 문제점
주제
3. The Market Forces of Supply and Demand - Part 1 of 2
11 주제
15 문제점
장
3. The Market Forces of Supply and Demand - Part 2 of 2
1 주제
3 문제점
장
VideoThumbView.guidedCourse
01:48
Consumer Income:Normal Goods and Inferior Goods
4600
views
69
rank
VideoThumbView.guidedCourse
04:10
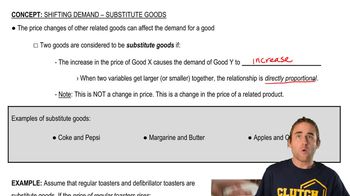
Substitute Goods
2573
views
36
rank
VideoThumbView.guidedCourse
02:18
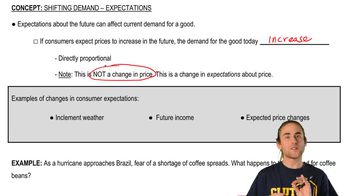
Consumer Expectations
3146
views
32
rank
이 집합의 용어 (15)
하이드의 정의
Demand Curve
A graphical representation showing the relationship between price and the quantity consumers are willing to buy at each price.
Normal Goods
Products for which demand increases as consumer income rises, often associated with higher quality or luxury.
Inferior Goods
Items for which demand decreases as consumer income rises, typically considered lower quality or budget options.
Substitute Goods
Products that can replace each other; a price increase in one leads to higher demand for the other.
Complementary Goods
Items usually purchased together; a price increase in one causes demand for the other to fall.
Consumer Preferences
Tastes and trends influencing demand; shifts occur when popularity or desirability of a product changes.
Consumer Expectations
Beliefs about future prices or income that affect current demand, often leading to increased purchases if higher prices are anticipated.
Number of Consumers
The total population of buyers in a market; more buyers generally result in higher demand.
Directly Proportional Relationship
A situation where two variables move in the same direction, such as income and demand for normal goods.
Inversely Proportional Relationship
A scenario where one variable rises as the other falls, like price of complements and demand.
Quantity Demanded
The specific amount of a product consumers are willing to buy at a given price, represented by movement along the curve.
Shift to the Right
An increase in demand, shown as the demand curve moving outward, often due to positive market changes.
Shift to the Left
A decrease in demand, depicted as the demand curve moving inward, usually caused by negative market factors.
Advertising
A tool for increasing the number of consumers by raising awareness and desirability of a product.
Market
The environment where buyers and sellers interact, influencing demand through various determinants.
 뒤로뒤로
뒤로뒤로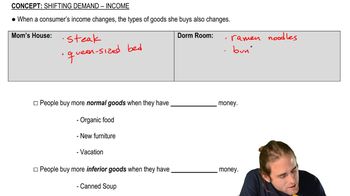
 01:48
01:48