Skip to main content
Microeconomics
나의 코스
배우기
시험 준비
AI 튜터
학습 가이드
플래시카드
탐험해 보세요
앱을 사용해 보세요
나의 코스
배우기
시험 준비
AI 튜터
학습 가이드
플래시카드
탐험해 보세요
앱을 사용해 보세요
뒤로
Short Run Phillips Curve quiz
카드를 뒤집기 위해 탭할 수 있습니다.
What does the short-run Phillips curve illustrate?
카드를 뒤집기 위해 탭할 수 있습니다.
👆
What does the short-run Phillips curve illustrate?
It illustrates the inverse relationship between inflation and unemployment: as inflation rises, unemployment falls, and vice versa.
진행 상황 추적
컨트롤 버튼이 '내비게이션' 모드로 변경되었습니다.
1/15
관련 플래시카드
추천 영상
Short Run Phillips Curve definitions
Short Run Phillips Curve
15 용어
VideoThumbView.guidedCourse
09:33
Short Run Phillips Curve
3
views
이 집합의 용어 (15)
하이드의 정의
What does the short-run Phillips curve illustrate?
It illustrates the inverse relationship between inflation and unemployment: as inflation rises, unemployment falls, and vice versa.
What happens to unemployment when inflation increases according to the short-run Phillips curve?
Unemployment decreases as inflation increases.
How does aggregate demand affect inflation and unemployment in the AD-AS model?
Higher aggregate demand raises inflation and lowers unemployment, while lower aggregate demand decreases inflation and increases unemployment.
What are the axes on the short-run Phillips curve graph?
The y-axis represents the inflation rate, and the x-axis represents the unemployment rate.
Why is it difficult to control both inflation and unemployment simultaneously?
Because they have an inverse relationship; reducing one often causes the other to increase.
What happens to GDP and employment when aggregate demand increases?
GDP increases and more workers are needed, leading to higher employment and lower unemployment.
If aggregate demand decreases, what happens to price levels and unemployment?
Price levels decrease (lower inflation), and unemployment increases due to less demand for workers.
How is the short-run Phillips curve derived from the AD-AS model?
By comparing different aggregate demand scenarios and plotting their corresponding inflation and unemployment rates.
What does a downward-sloping short-run Phillips curve indicate?
It indicates an inverse relationship between inflation and unemployment.
In the example, what was the inflation rate when aggregate demand was high?
The inflation rate was 6% when aggregate demand was high.
What was the unemployment rate when aggregate demand was high in the example?
The unemployment rate was 4% when aggregate demand was high.
What was the inflation rate when aggregate demand was low in the example?
The inflation rate was 2% when aggregate demand was low.
What was the unemployment rate when aggregate demand was low in the example?
The unemployment rate was 7% when aggregate demand was low.
What is the key takeaway about the relationship between inflation and unemployment from the short-run Phillips curve?
As inflation increases, unemployment decreases, and as inflation decreases, unemployment increases.
How does the short-run Phillips curve differ from other economic curves?
Its axes are inflation rate and unemployment rate, rather than price and quantity.
 뒤로뒤로
뒤로뒤로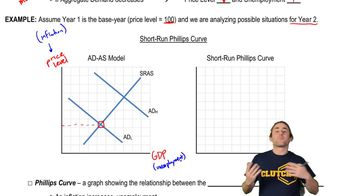
 09:33
09:33