Skip to main content
Microeconomics
나의 코스
배우기
시험 준비
AI 튜터
학습 가이드
플래시카드
탐험해 보세요
앱을 사용해 보세요
나의 코스
배우기
시험 준비
AI 튜터
학습 가이드
플래시카드
탐험해 보세요
앱을 사용해 보세요
뒤로
Slope of Linear Graphs definitions
카드를 뒤집기 위해 탭할 수 있습니다.
Slope
카드를 뒤집기 위해 탭할 수 있습니다.
👆
Slope
Ratio of vertical change to horizontal change between two points, indicating direction and steepness of a line.
진행 상황 추적
컨트롤 버튼이 '내비게이션' 모드로 변경되었습니다.
1/15
관련 플래시카드
관련 실천
추천 영상
Slope of Linear Graphs quiz #1
Slope of Linear Graphs
10 용어
Slope of Linear Graphs
1. Reading and Understanding Graphs
10 문제점
주제
Slope of a Curve at a Point
1. Reading and Understanding Graphs
10 문제점
주제
1. Reading and Understanding Graphs
9 주제
15 문제점
장
VideoThumbView.guidedCourse
07:47
Calculating Slope of a Straight Line
4407
views
60
rank
이 집합의 용어 (15)
하이드의 정의
Slope
Ratio of vertical change to horizontal change between two points, indicating direction and steepness of a line.
Rise
Amount of change along the vertical axis between two points, positive for upward movement and negative for downward.
Run
Amount of change along the horizontal axis between two points, positive for rightward movement and negative for leftward.
Vertical Axis
Reference line on a graph representing values that change up or down, typically labeled as Y.
Horizontal Axis
Reference line on a graph representing values that change left or right, typically labeled as X.
Intersection
Point where a line crosses grid lines on a graph, used for accurate slope calculation.
Positive Slope
Line characteristic where movement from left to right results in an upward trend, indicating growth.
Negative Slope
Line characteristic where movement from left to right results in a downward trend, indicating decline.
Steepness
Degree to which a line inclines or declines, with larger absolute slope values indicating greater tilt.
Grid Lines
Horizontal and vertical lines on a graph that help identify exact points for calculations.
Fraction
Numerical expression representing the ratio of rise to run, used to describe slope values.
Trend
General direction in which a line moves, either upward or downward, as shown by the slope.
Uphill
Visual representation of a line with positive slope, moving upward from left to right.
Downhill
Visual representation of a line with negative slope, moving downward from left to right.
Point
Specific location on a graph defined by coordinates, used to determine rise and run for slope calculation.
 뒤로뒤로
뒤로뒤로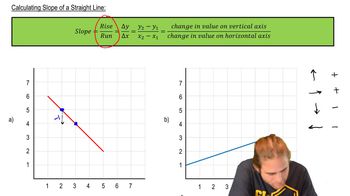
 07:47
07:47