Skip to main content
Microeconomics
나의 코스
배우기
시험 준비
AI 튜터
학습 가이드
플래시카드
탐험해 보세요
앱을 사용해 보세요
나의 코스
배우기
시험 준비
AI 튜터
학습 가이드
플래시카드
탐험해 보세요
앱을 사용해 보세요
뒤로
Total Revenue Along a Linear Demand Curve definitions
카드를 뒤집기 위해 탭할 수 있습니다.
Elasticity
카드를 뒤집기 위해 탭할 수 있습니다.
👆
Elasticity
Ratio of percentage changes between two variables, indicating responsiveness of one variable to changes in another.
진행 상황 추적
컨트롤 버튼이 '내비게이션' 모드로 변경되었습니다.
1/14
관련 플래시카드
관련 실천
추천 영상
Total Revenue Along a Linear Demand Curve quiz #1
Total Revenue Along a Linear Demand Curve
10 용어
Total Revenue Along a Linear Demand Curve
4. Elasticity
10 문제점
주제
Income Elasticity of Demand
4. Elasticity
10 문제점
주제
4. Elasticity
11 주제
15 문제점
장
VideoThumbView.guidedCourse
07:13
Total Revenue Along a Linear Demand Curve
3033
views
30
rank
이 집합의 용어 (14)
하이드의 정의
Elasticity
Ratio of percentage changes between two variables, indicating responsiveness of one variable to changes in another.
Slope
Ratio of unit changes between two variables, measured in specific units, not percentages.
Linear Demand Curve
Graphical representation connecting price and quantity axes with a straight line, showing constant unit changes.
Elastic Demand
Section of a demand curve where percentage change in quantity exceeds percentage change in price.
Inelastic Demand
Section of a demand curve where percentage change in price exceeds percentage change in quantity.
Unit Elasticity
Point on a demand curve where percentage change in price equals percentage change in quantity.
Total Revenue
Product of price and quantity, showing how much money is generated at each point along the demand curve.
Price Axis
Vertical axis on a graph representing different price levels for a good or service.
Quantity Axis
Horizontal axis on a graph representing different quantities demanded for a good or service.
Revenue Maximization
Point on a demand curve where total revenue reaches its highest value.
Percentage Change
Relative change between two values, expressed as a proportion of the original value.
Middle Point
Central location on a linear demand curve where unit elasticity and maximum revenue occur.
Graphical Representation
Visual display of relationships between variables, such as price, quantity, and total revenue.
Demand Schedule
Table listing prices and corresponding quantities demanded, used to plot the demand curve.
 뒤로뒤로
뒤로뒤로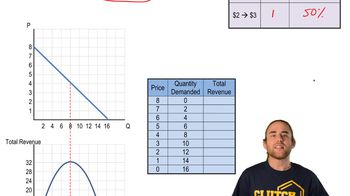
 07:13
07:13