Ch. 5 - Alkenes: Structure, Nomenclature, and an Introduction to Reactivity • Thermodynamics and Kinetics
Bruice - Organic Chemistry 8th Edition
Bruice8th EditionOrganic ChemistryISBN: 9780135213711당신이 사용하는 게 아니라요?교과서 변경
5장, 문제 37a-d

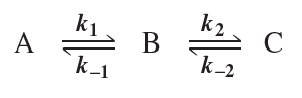
Draw a reaction coordinate diagram for the following reaction in which C is the most stable and B the least stable of the three species and the transition state going from A to B is more stable than the transition state going from B to C:
Reaction coordinate diagram showing species A, B, and C with transition states and rate constants labeled.
a. How many intermediates are there?
b. How many transition states are there?
c. Which step has the greater rate constant in the forward direction?
d. Which step has the greater rate constant in the reverse direction?

검증된 단계별 안내
1
Step 1: Analyze the reaction coordinate diagram requirements. The reaction involves three species (A, B, and C), where C is the most stable and B is the least stable. This means the energy of C is the lowest, and the energy of B is the highest. A is intermediate in stability.
Step 2: Identify the transition states. Transition states occur at the peaks of the energy barriers between species. Since there are two steps in the reaction (A to B and B to C), there will be two transition states. The transition state going from A to B is more stable (lower energy) than the transition state going from B to C.
Step 3: Determine the number of intermediates. Intermediates are species that exist in valleys between transition states. In this reaction, B is the intermediate because it is formed after A and before C.
Step 4: Compare the rate constants in the forward direction. The rate constant for the forward direction depends on the height of the energy barrier. Since the transition state from A to B is more stable (lower energy barrier), the rate constant for the step A to B (k1) will be greater than the rate constant for the step B to C (k2).
Step 5: Compare the rate constants in the reverse direction. The reverse rate constant depends on the energy barrier for the reverse reaction. Since B is the least stable species, the reverse rate constant for the step B to A (k-1) will be greater than the reverse rate constant for the step C to B (k-2).

비슷한 문제에 대한 검증된 영상 답변:

이 영상 해법은 위 문제에 도움이 된다고 튜터들이 추천한 것입니다.
영상 길이:
8m

주요 개념

질문에 올바르게 답하기 위해 반드시 이해해야 하는 핵심 개념들은 다음과 같습니다.

Reaction Coordinate Diagram

A reaction coordinate diagram visually represents the energy changes during a chemical reaction. It plots the energy of the reactants, products, and transition states against the progress of the reaction. The diagram helps identify intermediates and transition states, illustrating the stability of each species and the energy barriers that must be overcome for the reaction to proceed.
추천 영상:
05:02
Coordination Complexes

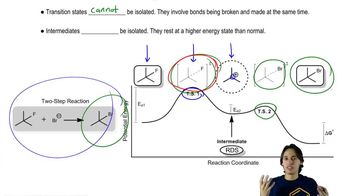
Transition States and Intermediates

Transition states are high-energy states that occur during the transformation from reactants to products, representing the point of maximum energy along the reaction pathway. Intermediates, on the other hand, are species that exist at a lower energy than the transition states and are formed during the reaction but are not the final products. Understanding the distinction between these two concepts is crucial for analyzing reaction mechanisms.
추천 영상:
06:55
Intermediates vs. Transition States

Rate Constants and Reaction Rates

Rate constants (k) quantify the speed of a reaction and are influenced by the energy barriers associated with the transition states. A higher rate constant indicates a faster reaction. In the context of the given question, comparing the rate constants for the forward and reverse reactions helps determine which step is more favorable and provides insight into the overall kinetics of the reaction.
추천 영상:
가이드 코스
2:29
Rates of Intramolecular Reactions Concept 1
관련 실천