Ch. 6 - The Reactions of Alkenes • The Stereochemistry of Addition Reactions
Bruice - Organic Chemistry 8th Edition
Bruice8th EditionOrganic ChemistryISBN: 9780135213711당신이 사용하는 게 아니라요?교과서 변경
6장, 문제 5

Is the structure of the transition state in the following reaction coordinate diagrams more similar to the structure of the reactant or to the structure of the product?
<IMAGE>

검증된 단계별 안내
1
Step 1: Analyze the reaction coordinate diagrams provided. Each diagram represents the energy profile of a reaction, with the x-axis showing the reaction progress and the y-axis showing the energy. The peak in each diagram corresponds to the transition state, which is the highest energy point along the reaction pathway.
Step 2: Apply Hammond's Postulate, which states that the structure of the transition state is more similar to the species (reactant or product) that is closer in energy to it. If the transition state is closer in energy to the reactants, it will resemble the reactants more. Conversely, if it is closer in energy to the products, it will resemble the products more.
Step 3: For diagram (a), observe that the energy of the transition state is closer to the reactants than the products. This suggests that the transition state structure is more similar to the reactants.
Step 4: For diagram (b), note that the transition state is approximately equidistant in energy between the reactants and products. This indicates that the transition state may have characteristics of both reactants and products.
Step 5: For diagrams (c) and (d), observe that the transition state is closer in energy to the products than the reactants. This suggests that the transition state structure is more similar to the products.

비슷한 문제에 대한 검증된 영상 답변:

이 영상 해법은 위 문제에 도움이 된다고 튜터들이 추천한 것입니다.
영상 길이:
2m

주요 개념

질문에 올바르게 답하기 위해 반드시 이해해야 하는 핵심 개념들은 다음과 같습니다.

Transition State Theory

Transition State Theory posits that during a chemical reaction, reactants pass through a high-energy transition state before forming products. This state represents a point of maximum energy along the reaction coordinate, where bonds are partially broken and formed. Understanding this concept is crucial for analyzing reaction coordinate diagrams, as it helps identify the characteristics of the transition state in relation to reactants and products.
추천 영상:
06:55
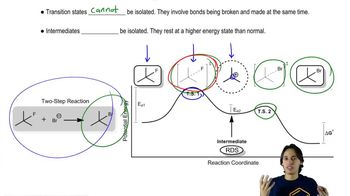
Intermediates vs. Transition States

Reaction Coordinate Diagrams

Reaction coordinate diagrams visually represent the energy changes during a chemical reaction. The x-axis typically shows the progress of the reaction, while the y-axis indicates the energy of the system. These diagrams illustrate the energy of reactants, products, and the transition state, allowing for a comparison of their relative energies and structures, which is essential for answering the posed question.
추천 영상:
05:02
Coordination Complexes

Stability of Reactants and Products

The stability of reactants and products is determined by their energy levels; lower energy states are more stable. In the context of transition states, understanding whether the transition state resembles the reactants or products can provide insights into the reaction mechanism. If the transition state is closer in energy to the reactants, the reaction may be more favorable, while a transition state resembling the products suggests a different energy profile and reaction pathway.
추천 영상:
05:58
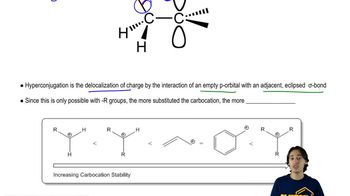
Determining Carbocation Stability