Skip to main content
Physics with Calculus
나의 코스
배우기
시험 준비
AI 튜터
학습 가이드
교과서적 해결책
플래시카드
탐험해 보세요
앱을 사용해 보세요
나의 코스
배우기
시험 준비
AI 튜터
학습 가이드
교과서적 해결책
플래시카드
탐험해 보세요
앱을 사용해 보세요
뒤로
PV Diagrams & Work quiz
카드를 뒤집기 위해 탭할 수 있습니다.
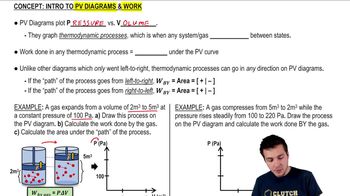
What does a PV diagram plot on its axes?
카드를 뒤집기 위해 탭할 수 있습니다.
👆
What does a PV diagram plot on its axes?
A PV diagram plots pressure (P) on the y-axis and volume (V) on the x-axis.
진행 상황 추적
컨트롤 버튼이 '내비게이션' 모드로 변경되었습니다.
1/15
관련 플래시카드
관련 실천
추천 영상
PV Diagrams & Work definitions
PV Diagrams & Work
15 용어
PV Diagrams & Work
22. The First Law of Thermodynamics
3 문제점
주제
Patrick
Cyclic Thermodynamic Processes
22. The First Law of Thermodynamics
5 문제점
주제
Patrick
22. The First Law of Thermodynamics
5 주제
13 문제점
장
Patrick
VideoThumbView.guidedCourse
04:07
Finding Value of V on Axis
2645
views
46
rank
VideoThumbView.guidedCourse
08:07
Work and PV Diagrams
4290
views
41
rank
이 집합의 용어 (15)
하이드의 정의
What does a PV diagram plot on its axes?
A PV diagram plots pressure (P) on the y-axis and volume (V) on the x-axis.
What does the area under the curve in a PV diagram represent?
The area under the curve represents the work done during a thermodynamic process.
How do you calculate work done by a gas at constant pressure using a PV diagram?
Work is calculated using the formula W = P × ΔV, where P is constant pressure and ΔV is the change in volume.
What is the work done when a gas expands from 2 to 5 m³ at a constant pressure of 100 units?
The work done is 300 joules, calculated as W = 100 × (5 - 2) = 300 J.
How do you find the area under the curve for a constant pressure process on a PV diagram?
For constant pressure, the area is a rectangle with base ΔV and height P, so area = P × ΔV.
Why is the work done equal to the area under the curve in a PV diagram?
Because the area under the curve mathematically represents the integral of P dV, which is the definition of work in thermodynamics.
What must you do if pressure is not constant during a process on a PV diagram?
You must calculate the area under the curve by dividing it into simpler shapes, such as rectangles and triangles.
Why can't you use W = PΔV when pressure changes during a process?
Because W = PΔV only applies when pressure is constant; with variable pressure, you need to use the area under the curve.
How do you calculate the work done when a gas compresses from 5 to 2 m³ and pressure rises from 100 to 220 units?
Divide the area under the curve into a triangle and a rectangle, calculate each area, and sum them, considering the direction for sign.
What is the total work done in the compression example where the gas goes from 5 to 2 m³ and pressure from 100 to 220 units?
The total work done is -480 joules, indicating work done on the gas.
How do you determine the sign of work from the direction of the process on a PV diagram?
If the process goes from left to right (increasing volume), work is positive; if from right to left (decreasing volume), work is negative.
What does a negative value for work indicate in a PV diagram process?
A negative work value means work is done on the gas, such as during compression.
Why is it important to indicate the direction of the process on a PV diagram?
Because the direction determines the sign of the work and ensures correct calculation.
What is the formula for the area of a triangle used in PV diagram work calculations?
The area of a triangle is (1/2) × base × height.
What is the relationship between the base and height of shapes under the curve and the variables in the work formula?
The base corresponds to the change in volume (ΔV), and the height corresponds to pressure (P).
 뒤로뒤로
뒤로뒤로
 04:07
04:07