Ch 01: Concepts of Motion
Knight Calc - Physics for Scientists and Engineers 5th Edition
Knight Calc5th EditionPhysics for Scientists and EngineersISBN: 9780137344796당신이 사용하는 게 아니라요?교과서 변경
1장, 문제 6

You drop a soccer ball from your third-story balcony. Use the particle model to draw a motion diagram showing the ball's position and average velocity vectors from the time you release the ball until the instant it touches the ground.

검증된 단계별 안내
1
Step 1: Understand the particle model. In the particle model, the soccer ball is represented as a single point (particle) to simplify its motion. This allows us to focus on its position and velocity without considering its size or shape.
Step 2: Identify the forces acting on the ball. Since the ball is dropped, the only force acting on it is gravity, which causes it to accelerate downward. Air resistance is neglected in this model.
Step 3: Break down the motion into time intervals. Divide the motion into equal time intervals (e.g., every 0.5 seconds). At each interval, the ball's position will change due to its increasing velocity caused by constant acceleration.
Step 4: Draw the motion diagram. Represent the ball's position at each time interval as a dot. The spacing between the dots will increase as the ball accelerates downward, indicating that the ball is moving faster over time.
Step 5: Add average velocity vectors. For each interval, draw an arrow between consecutive dots to represent the average velocity vector. The length of the arrow should increase as the ball accelerates, and the direction of the arrows should point downward, consistent with the motion caused by gravity.

비슷한 문제에 대한 검증된 영상 답변:

이 영상 해법은 위 문제에 도움이 된다고 튜터들이 추천한 것입니다.
영상 길이:
2m

주요 개념

질문에 올바르게 답하기 위해 반드시 이해해야 하는 핵심 개념들은 다음과 같습니다.

Particle Model

The particle model simplifies an object to a single point mass, allowing us to analyze its motion without considering its size or shape. This model is particularly useful in physics for visualizing and calculating the motion of objects under the influence of forces, such as gravity. By treating the soccer ball as a particle, we can focus on its trajectory and the changes in its position over time.
추천 영상:
가이드 코스
07:21
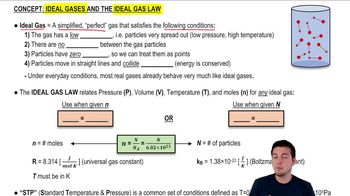
Ideal Gases and the Ideal Gas Law

Motion Diagram

A motion diagram is a visual representation that illustrates an object's position at various time intervals during its motion. It typically includes a series of dots or arrows that indicate the object's location and direction of movement. In this case, the motion diagram will show the soccer ball's descent, with vectors representing its average velocity at different points, helping to visualize how its speed and direction change as it falls.
추천 영상:
가이드 코스
08:07
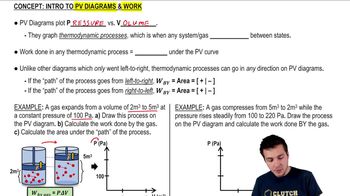
Work and PV Diagrams

Average Velocity

Average velocity is defined as the total displacement divided by the total time taken for that displacement. It is a vector quantity, meaning it has both magnitude and direction. In the context of the falling soccer ball, the average velocity will change as it accelerates due to gravity, and it can be represented in the motion diagram as arrows that indicate the direction of motion and the increasing speed of the ball as it approaches the ground.
추천 영상:
가이드 코스
05:44
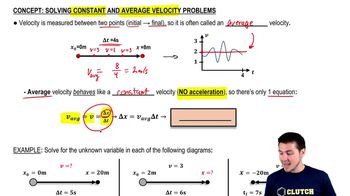
Solving Constant and Average Velocity Problems