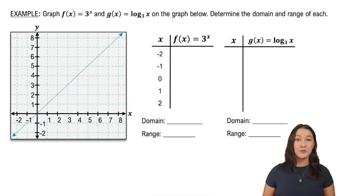
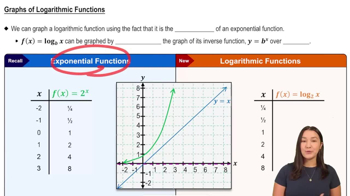
What is the relationship between exponential and logarithmic functions?
Logarithmic functions are the inverse of exponential functions; their graphs are reflections of each other over the line y = x.
How do you find ordered pairs for the graph of log base 2 of x?
Plug in values for x, such as x = 1 and x = 2, to get points like (1, 0) and (2, 1).
What happens to the ordered pairs from an exponential function when graphing its inverse logarithmic function?
The x and y values are flipped to create the ordered pairs for the logarithmic function.
Where is the vertical asymptote for a logarithmic function located?
The vertical asymptote is at x = 0 for the parent logarithmic function.
What is the domain of the parent logarithmic function?
The domain is all positive real numbers, typically written as (0, ∞).
What is the range of any logarithmic function, regardless of transformations?
The range is all real numbers, written as (−∞, ∞).
How does the base of a logarithmic function affect the direction of its graph?
If the base is greater than 1, the graph increases; if the base is between 0 and 1, the graph decreases.
What is the parent function for g(x) = log base 2 of (x - 1) - 4?
The parent function is f(x) = log base 2 of x.
What does a negative sign outside a logarithmic function indicate?
It indicates a reflection over the x-axis.
What does a negative sign inside a logarithmic function indicate?
It indicates a reflection over the y-axis.
How do you apply horizontal and vertical shifts to a logarithmic function?
Shift the graph horizontally by h units and vertically by k units, where h and k are from the function's form.
How do you determine the new vertical asymptote after a horizontal shift?
The vertical asymptote moves to x = h, where h is the horizontal shift.
How do you plot key points for a transformed logarithmic function?
Shift the parent function's key points by h units right and k units down or up, then plot them.
How do you determine the domain of a transformed logarithmic function?
The domain starts at the new vertical asymptote (x = h) and goes to infinity if approaching from the right, or from negative infinity to h if approaching from the left.
What is the final step in graphing a transformed logarithmic function?
Connect the shifted points with a curve that approaches the vertical asymptote, sketching the graph.
 뒤로
뒤로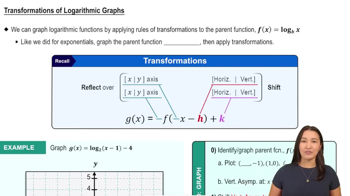
 4:37
4:37