Skip to main content
Precalculus
나의 코스
배우기
시험 준비
AI 튜터
학습 가이드
플래시카드
탐험해 보세요
앱을 사용해 보세요
나의 코스
배우기
시험 준비
AI 튜터
학습 가이드
플래시카드
탐험해 보세요
앱을 사용해 보세요
뒤로
Graphs of the Sine and Cosine Functions quiz
카드를 뒤집기 위해 탭할 수 있습니다.
What coordinate on the unit circle is associated with the sine function?
카드를 뒤집기 위해 탭할 수 있습니다.
👆
What coordinate on the unit circle is associated with the sine function?
The sine function is associated with the y-coordinate on the unit circle.
진행 상황 추적
컨트롤 버튼이 '내비게이션' 모드로 변경되었습니다.
1/15
관련 플래시카드
관련 실천
추천 영상
Graphs of the Sine and Cosine Functions definitions
Graphs of the Sine and Cosine Functions
15 용어
Graphs of the Sine and Cosine Functions
10. Graphing Trigonometric Functions
6 문제점
주제
Phase Shifts
10. Graphing Trigonometric Functions
3 문제점
주제
10. Graphing Trigonometric Functions
4 주제
7 문제점
장
5:05
Amplitude and Reflection of Sine and Cosine
1702
views
50
rank
2:18
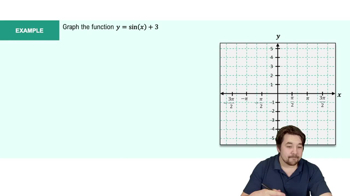
Example 1
1481
views
37
rank
1
comments
5:53
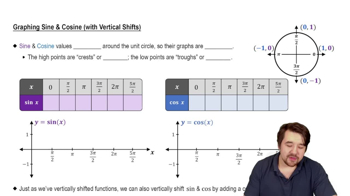
Graph of Sine and Cosine Function
2985
views
92
rank
1
comments
이 집합의 용어 (15)
하이드의 정의
What coordinate on the unit circle is associated with the sine function?
The sine function is associated with the y-coordinate on the unit circle.
What coordinate on the unit circle is associated with the cosine function?
The cosine function is associated with the x-coordinate on the unit circle.
What is the general shape of the graphs of sine and cosine functions?
Both sine and cosine graphs have a repeating wave pattern.
Where does the graph of y = sin(x) start on the y-axis?
The graph of y = sin(x) starts at 0 on the y-axis.
Where does the graph of y = cos(x) start on the y-axis?
The graph of y = cos(x) starts at 1 on the y-axis.
What are the high points and low points of a sine or cosine wave called?
High points are called peaks or crests, and low points are called valleys or troughs.
What effect does adding a constant k to y = sin(x) or y = cos(x) have on the graph?
Adding a constant k shifts the graph vertically; positive k shifts up, negative k shifts down.
How would the graph of y = sin(x) + 1 differ from y = sin(x)?
The graph of y = sin(x) + 1 is shifted up by 1 unit compared to y = sin(x).
What is the amplitude of y = sin(x) or y = cos(x)?
The amplitude is 1 for both y = sin(x) and y = cos(x).
How do you change the amplitude of a sine or cosine graph?
Multiply the function by a number; the amplitude becomes the absolute value of that number.
What happens to the graph if the amplitude is negative?
A negative amplitude reflects the graph over the x-axis.
What is the period of y = sin(x) or y = cos(x)?
The period is 2π for both y = sin(x) and y = cos(x).
How does the period change for y = sin(2x)?
The period becomes π, which is half the original period.
What is the formula for the period of y = sin(Bx) or y = cos(Bx)?
The period is calculated as 2π divided by B, where B is the coefficient of x.
If y = cos(4πx), what is the period of the function?
The period is 1/2, calculated as 2π divided by 4π.
 뒤로뒤로
뒤로뒤로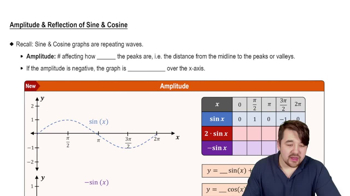
 5:05
5:05