뒤로

Graphing Polynomial Functions and Cubic Models

컨트롤 버튼이 '내비게이션' 모드로 변경되었습니다.
1/20
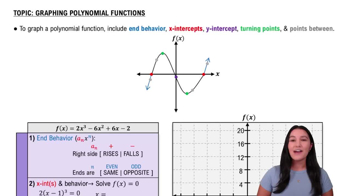
  • What is the end behavior of a polynomial function of degree 3 with a positive leading coefficient?

    The graph behaves like \(x^3\) for large values of x, rising to infinity as x approaches infinity and falling to negative infinity as x approaches negative infinity.
  • How do you find the y-intercept of a polynomial function?

    Evaluate the polynomial at x = 0; the y-intercept is f(0).
  • How do you find the x-intercepts of a polynomial function?

    Solve the equation f(x) = 0 to find the x-values where the graph crosses or touches the x-axis.
  • What does the multiplicity of a zero tell you about the graph at that zero?

    If the zero has odd multiplicity, the graph crosses the x-axis at that zero. If even multiplicity, the graph touches but does not cross the x-axis.
  • What is the maximum number of turning points for a polynomial function of degree n?

    At most n − 1 turning points.
  • How can additional points help when graphing a polynomial function?

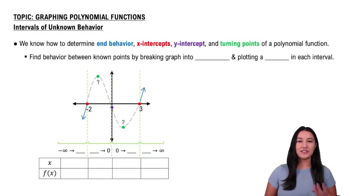
    Evaluating the function at points near the zeros helps establish the scale and shape of the graph.
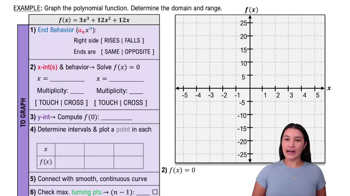
  • What is the end behavior of a polynomial function of degree 4 with a positive leading coefficient?

    The graph behaves like \(x^4\) for large values of x, rising to infinity as x approaches both positive and negative infinity.
  • How do you use the Zero-Product Property to find x-intercepts?

    Factor the polynomial and set each factor equal to zero, then solve for x.
  • What does a zero of multiplicity 2 indicate about the graph at that zero?

    The graph touches the x-axis and turns around at that zero without crossing it.
  • How do you use a graphing utility to find zeros of a polynomial function?

    Use the ZERO, ROOT, or SOLVE feature to approximate x-intercepts.
  • How do you find turning points using a graphing utility?

    Use the MAXIMUM and MINIMUM features to locate local maxima and minima on the graph.
  • What is the range of a cubic polynomial function with two turning points?

    The range is all real numbers, since the graph extends infinitely in both vertical directions.
  • How can you determine intervals where a polynomial function is increasing or decreasing?

    Analyze the graph or use a graphing utility to find intervals where the function rises or falls.
  • What type of relation might a scatter plot suggest if the data points curve like an S-shape?

    A cubic relation may exist between the variables.
  • How do you find a cubic function of best fit for data using a graphing utility?

    Use the CUBIC REGRESSION program to calculate the coefficients of the cubic model.
  • How do you use a cubic function of best fit to make predictions?

    Evaluate the cubic function at the desired x-value to predict the corresponding y-value.
  • What is the significance of the coefficients a, b, c, and d in a cubic regression equation \(y=ax^3+bx^2+cx+d\)?

    They determine the shape and position of the cubic curve that best fits the data.
  • Why is it helpful to graph the cubic function of best fit on the scatter plot?

    It visually shows how well the model fits the data points.
  • What does it mean if a polynomial function has a zero at x = 2 with multiplicity 1?

    The graph crosses the x-axis at x = 2.
  • What does it mean if a polynomial function has a zero at x = -3 with multiplicity 2?

    The graph touches the x-axis at x = -3 but does not cross it.