Skip to main content
Precalculus
나의 코스
배우기
시험 준비
AI 튜터
학습 가이드
플래시카드
탐험해 보세요
앱을 사용해 보세요
나의 코스
배우기
시험 준비
AI 튜터
학습 가이드
플래시카드
탐험해 보세요
앱을 사용해 보세요
뒤로
Graphs and Properties of Sine and Cosine Functions
카드를 뒤집기 위해 탭할 수 있습니다.
Domain of sine and cosine functions
카드를 뒤집기 위해 탭할 수 있습니다.
👆
Domain of sine and cosine functions
The domain of both sine and cosine functions is the set of all real numbers.
진행 상황 추적
컨트롤 버튼이 '내비게이션' 모드로 변경되었습니다.
1/20
추천 영상
5:05
Amplitude and Reflection of Sine and Cosine
1758
views
53
rank
2:18
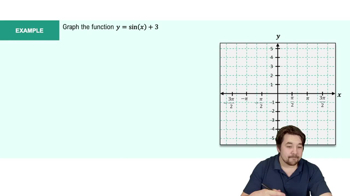
Example 1
1529
views
39
rank
1
comments
5:53
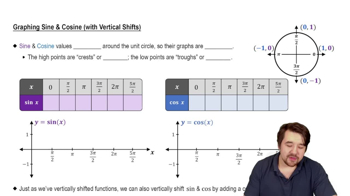
Graph of Sine and Cosine Function
3086
views
98
rank
1
comments
이 집합의 용어 (20)
하이드의 정의
Domain of sine and cosine functions
The domain of both sine and cosine functions is the set of all real numbers.
Range of sine and cosine functions
The range of sine and cosine functions is all real numbers from −1 to 1, inclusive.
Period of sine and cosine functions
Both sine and cosine functions have a period of \(2\pi\).
Symmetry of sine function
The sine function is an odd function, symmetric with respect to the origin.
Symmetry of cosine function
The cosine function is an even function, symmetric with respect to the y-axis.
Maximum and minimum values of sine and cosine
Both sine and cosine functions have a maximum value of 1 and a minimum value of −1.
Key x-intercepts of sine function
The sine function has x-intercepts at \(0, \pi, 2\pi\) and multiples thereof.
Key x-intercepts of cosine function
The cosine function has x-intercepts at \(\frac{\pi}{2}, \frac{3\pi}{2}\) and odd multiples thereof.
Effect of amplitude on sine and cosine graphs
Amplitude
A
stretches the graph vertically by a factor of
|A|
, changing the range to [−|A|, |A|].
Effect of frequency (omega) on period
For functions of the form
y = A sin(ωx)
or
y = A cos(ωx)
, the period is \(\frac{2\pi}{\omega}\).
Graphing sine function using key points
Divide one period into four equal subintervals to find five key points for plotting the sine curve.
Graphing cosine function using key points
Divide one period into four equal subintervals to find five key points for plotting the cosine curve.
Vertical shift in sinusoidal functions
Adding a constant
D
to
y = A sin(ωx) + D
or
y = A cos(ωx) + D
shifts the graph vertically by
D
units.
Horizontal compression/stretch in sinusoidal functions
Multiplying the input by
ω
compresses the graph horizontally by a factor of
1/ω
.
Equation form of sinusoidal functions
General form:
y = A sin(ωx + φ) + D
or
y = A cos(ωx + φ) + D
, where
φ
is phase shift.
Amplitude from sinusoidal equation
The amplitude is the absolute value of
A
in the sinusoidal function.
Period from sinusoidal equation
The period is calculated as \(\frac{2\pi}{|\omega|}\).
Finding sinusoidal equation from graph
Identify amplitude, period, phase shift, and vertical shift from the graph to write the equation.
Sine function key points in one period
At \(0, \frac{\pi}{2}, \pi, \frac{3\pi}{2}, 2\pi\), sine values are 0, 1, 0, −1, 0 respectively.
Cosine function key points in one period
At \(0, \frac{\pi}{2}, \pi, \frac{3\pi}{2}, 2\pi\), cosine values are 1, 0, −1, 0, 1 respectively.
 뒤로뒤로
뒤로뒤로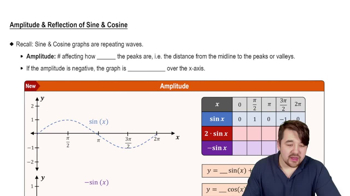
 5:05
5:05