Skip to main content
Introduction to Psychology
나의 코스
배우기
시험 준비
AI 튜터
학습 가이드
플래시카드
탐험해 보세요
앱을 사용해 보세요
나의 코스
배우기
시험 준비
AI 튜터
학습 가이드
플래시카드
탐험해 보세요
앱을 사용해 보세요
뒤로
Evaluating Research Findings definitions
카드를 뒤집기 위해 탭할 수 있습니다.
Descriptive Statistics
카드를 뒤집기 위해 탭할 수 있습니다.
👆
Descriptive Statistics
Summarizes data using values that represent typical scores and the spread of responses within a dataset.
진행 상황 추적
컨트롤 버튼이 '내비게이션' 모드로 변경되었습니다.
1/15
관련 플래시카드
관련 실천
추천 영상
Evaluating Research Findings quiz #1
Evaluating Research Findings
10 용어
Evaluating Research Findings
2. Psychology Research
7 문제점
주제
Nicole
APA Formatting - References
2. Psychology Research
7 문제점
주제
Nicole
2. Psychology Research
5 주제
14 문제점
장
Nicole
VideoThumbView.guidedCourse
00:58
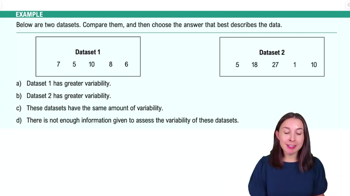
Evaluating Research Findings Example 2
727
views
3
rank
VideoThumbView.guidedCourse
04:17
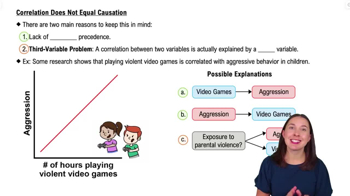
Correlation Does Not Equal Causation
659
views
5
rank
VideoThumbView.guidedCourse
03:23
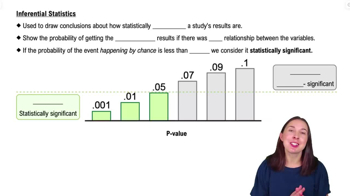
Inferential Statistics
669
views
2
rank
이 집합의 용어 (15)
하이드의 정의
Descriptive Statistics
Summarizes data using values that represent typical scores and the spread of responses within a dataset.
Mean
Represents the average value in a dataset, calculated by dividing the sum of all values by the number of values.
Median
Identifies the central value in an ordered dataset, unaffected by extreme scores or outliers.
Mode
Indicates the most frequently occurring value in a dataset; some datasets may have none or multiple.
Outlier
A value significantly higher or lower than others in a dataset, which can distort the mean.
Measures of Variability
Quantifies how spread out or clustered data points are within a dataset.
Range
Shows the difference between the highest and lowest values, reflecting overall data spread.
Standard Deviation
Indicates the average distance of each data point from the mean, with higher values showing more spread.
Correlation
Describes the direction and strength of a relationship between two variables, without implying causation.
Correlation Coefficient
A numerical value, often Pearson’s r, quantifying the strength and direction of a relationship between variables.
Temporal Precedence
Refers to knowing which variable occurred first, necessary for establishing causation.
Third-Variable Problem
Occurs when an unmeasured factor explains the relationship between two variables in a correlation.
Inferential Statistics
Assesses the likelihood that research findings are due to chance, supporting generalization to a population.
P-value
Represents the probability that observed results happened by chance; values below 0.05 indicate significance.
Statistical Significance
Indicates that research results are unlikely to have occurred by chance, typically when p < 0.05.
 뒤로뒤로
뒤로뒤로
 00:58
00:58