- 작성 시간을 절약하려면 워크시트를 다운로드하세요
- 연습 문제를 풀기 시작해
- 막히면 영상 해답을 보세요
- 더 많은 인사이트를 원하시면 요약을 참고하세요

Which of the following measurements, when collected from a large sample, is most likely to follow a normal distribution?
In a city, the monthly utility bills are normally distributed with a mean of and a standard deviation of . Find the area of the shaded region.
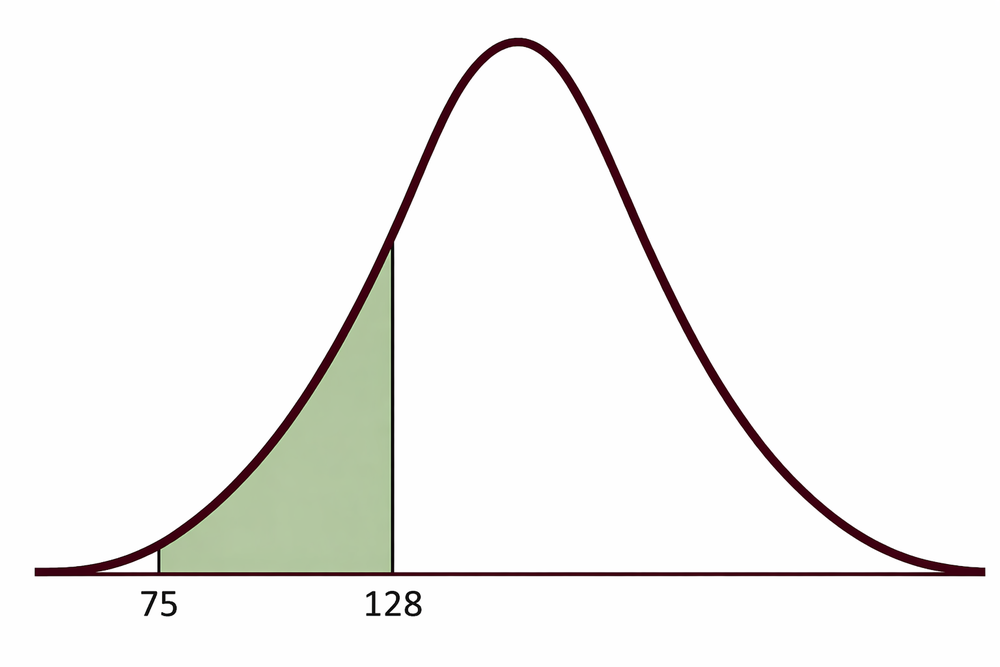
Assume that the heights of a group of students are normally distributed. Find the critical value . Round the result to two decimal places.
In a bone mineral density test, the test scores are normally distributed with a mean of and a standard deviation of . Find the probability that a randomly selected subject has a bone density test score greater than .
A researcher records the weights (in units of grams) of apples from an orchard: , , , , , , , , , , , , , , , and . The orchard claims that the weights are normally distributed with a mean of grams and a standard deviation of grams. Draw a frequency histogram to display these data points using classes. Does the data appear to be normally distributed?
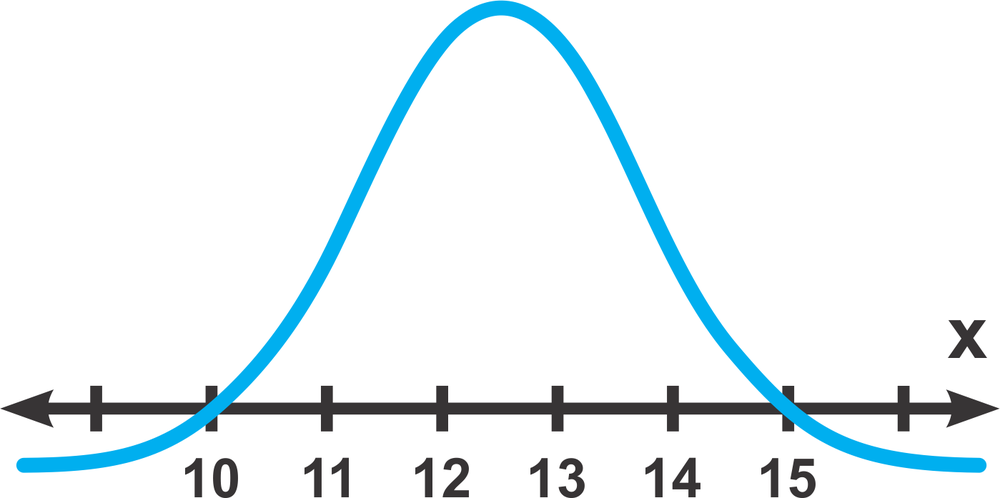
Could this graph represent a variable with a normal distribution? If so, estimate the mean and standard deviation. If not, explain your reasoning.
Suppose the random variable is normally distributed with a mean and a standard deviation . Find .