Skip to main content
Introductory Statistics
나의 코스
배우기
시험 준비
AI 튜터
학습 가이드
교과서적 해결책
플래시카드
탐험해 보세요
앱을 사용해 보세요
나의 코스
배우기
시험 준비
AI 튜터
학습 가이드
교과서적 해결책
플래시카드
탐험해 보세요
앱을 사용해 보세요
뒤로
Boxplots definitions
카드를 뒤집기 위해 탭할 수 있습니다.
Box Plot
카드를 뒤집기 위해 탭할 수 있습니다.
👆
Box Plot
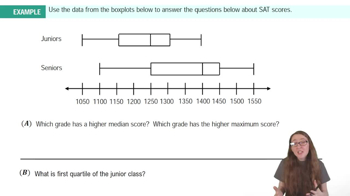
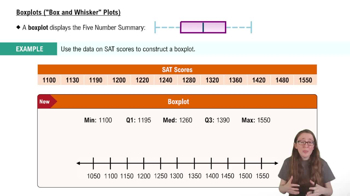
A visual summary of quantitative data using a box and whiskers to display the five-number summary.
진행 상황 추적
컨트롤 버튼이 '내비게이션' 모드로 변경되었습니다.
1/15
관련 플래시카드
관련 실천
추천 영상
Boxplots quiz #1
Boxplots
10 용어
Boxplots
3. Describing Data Numerically
5 문제점
주제
Brendan
3. Describing Data Numerically - Part 1 of 2
5 주제
15 문제점
장
David-Paige
3. Describing Data Numerically - Part 2 of 2
3 주제
8 문제점
장
Jonathan
VideoThumbView.guidedCourse
01:52
Boxplots Example 1
2313
views
40
rank
VideoThumbView.guidedCourse
02:48
Boxplots Example 2
2085
views
80
rank
VideoThumbView.guidedCourse
03:54
Boxplots ("Box and Whisker Plots")
3306
views
57
rank
1
comments
이 집합의 용어 (15)
하이드의 정의
Box Plot
A visual summary of quantitative data using a box and whiskers to display the five-number summary.
Five-Number Summary
A set of values including minimum, first quartile, median, third quartile, and maximum, used to describe data distribution.
Minimum
The smallest value in a dataset, marking the lower end of the box plot's whisker.
Maximum
The largest value in a dataset, marking the upper end of the box plot's whisker.
First Quartile
A value below which 25% of the data falls, also known as Q1 or the 25th percentile.
Third Quartile
A value below which 75% of the data falls, also known as Q3 or the 75th percentile.
Median
The middle value of a dataset, dividing it into two equal halves and marking the 50th percentile.
Interquartile Range
The distance between the first and third quartiles, representing the middle 50% of the data.
Whisker
A line extending from the box to the minimum or maximum, showing the spread outside the interquartile range.
Percentile
A measure indicating the relative position of a value within a dataset, such as 25th, 50th, or 75th.
Number Line
A scale used beneath the box plot to accurately mark the five-number summary values.
Data Spread
The extent to which values in a dataset are dispersed, visually indicated by the length of the box and whiskers.
Central Tendency
A characteristic describing the center of a dataset, often highlighted by the median in a box plot.
Quartile
A division of data into four equal parts, with Q1 and Q3 marking the boundaries of the box in a box plot.
Scale
A reference for ensuring accurate placement and proportionality of values in a box plot.
 뒤로뒤로
뒤로뒤로
 01:52
01:52