Skip to main content
Introductory Statistics
나의 코스
배우기
시험 준비
AI 튜터
학습 가이드
교과서적 해결책
플래시카드
탐험해 보세요
앱을 사용해 보세요
나의 코스
배우기
시험 준비
AI 튜터
학습 가이드
교과서적 해결책
플래시카드
탐험해 보세요
앱을 사용해 보세요
뒤로
Homogeneity Tests definitions
카드를 뒤집기 위해 탭할 수 있습니다.
Homogeneity Test
카드를 뒤집기 위해 탭할 수 있습니다.
👆
Homogeneity Test
Assesses if proportions of a characteristic are equal across multiple populations using contingency tables.
진행 상황 추적
컨트롤 버튼이 '내비게이션' 모드로 변경되었습니다.
1/15
관련 플래시카드
관련 실천
추천 영상
Homogeneity Tests quiz
Homogeneity Tests
15 용어
Chi Square Test for Homogeneity
13. Chi-Square Tests & Goodness of Fit
3 문제점
주제
13. Chi-Square Tests & Goodness of Fit
4 주제
5 문제점
장
VideoThumbView.guidedCourse
05:27
Homogeneity Test
358
views
5
rank
VideoThumbView.guidedCourse
06:28
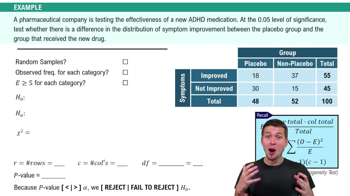
Homogeneity Test Example 1
281
views
4
rank
이 집합의 용어 (15)
하이드의 정의
Homogeneity Test
Assesses if proportions of a characteristic are equal across multiple populations using contingency tables.
Contingency Table
Displays frequencies for combinations of categories, allowing comparison of proportions across groups.
Null Hypothesis
Assumes equal proportions of a characteristic across all populations being compared.
Alternative Hypothesis
Suggests at least one population has a different proportion of the characteristic.
Chi-square Statistic
Quantifies the discrepancy between observed and expected frequencies in categorical data.
Observed Frequency
Represents the actual count recorded for each category in the data.
Expected Frequency
Represents the theoretical count for each category if proportions were equal across populations.
Degrees of Freedom
Determined by the number of rows and columns in a contingency table, affecting the chi-square calculation.
P-value
Indicates the probability of observing a result as extreme as the sample, assuming equal proportions.
Alpha
Represents the threshold for statistical significance, often set at 0.05.
Random Sample
Ensures each member of the population has an equal chance of selection, supporting valid inference.
Characteristic
Refers to the trait or property, such as car ownership, whose proportion is compared across groups.
Population
Denotes the distinct groups, like age categories, being compared for a specific characteristic.
Independence Test
Examines whether two variables are related, differing from homogeneity tests in hypothesis focus.
Statistical Significance
Indicates that observed differences are unlikely due to random chance, based on the p-value and alpha.
 뒤로뒤로
뒤로뒤로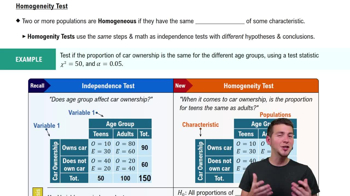
 05:27
05:27