Skip to main content
Introductory Statistics
나의 코스
배우기
시험 준비
AI 튜터
학습 가이드
교과서적 해결책
플래시카드
탐험해 보세요
앱을 사용해 보세요
나의 코스
배우기
시험 준비
AI 튜터
학습 가이드
교과서적 해결책
플래시카드
탐험해 보세요
앱을 사용해 보세요
뒤로
Contingency Tables definitions
카드를 뒤집기 위해 탭할 수 있습니다.
Contingency Table
카드를 뒤집기 위해 탭할 수 있습니다.
👆
Contingency Table
A matrix displaying frequencies for two categorical variables, enabling analysis of their relationship and calculation of expected values.
진행 상황 추적
컨트롤 버튼이 '내비게이션' 모드로 변경되었습니다.
1/15
관련 플래시카드
관련 실천
추천 영상
Contingency Tables quiz #1
Contingency Tables
10 용어
Introduction to Contingency Tables
13. Chi-Square Tests & Goodness of Fit
3 문제점
주제
Chi Square Test for Independence
13. Chi-Square Tests & Goodness of Fit
3 문제점
주제
13. Chi-Square Tests & Goodness of Fit
4 주제
5 문제점
장
VideoThumbView.guidedCourse
08:18
Contingency Tables & Expected Frequencies
764
views
10
rank
1
comments
이 집합의 용어 (15)
하이드의 정의
Contingency Table
A matrix displaying frequencies for two categorical variables, enabling analysis of their relationship and calculation of expected values.
Categorical Variable
A data type representing distinct groups or categories, such as grade levels or height ranges, used in frequency analysis.
Observed Frequency
The actual count recorded in each cell of a table, reflecting the real data collected for specific category combinations.
Expected Frequency
A calculated value predicting the count in a cell, assuming the variables are independent, based on row and column totals.
Independence
A condition where the occurrence of one variable does not affect the probability of the other, crucial for expected frequency calculations.
Row Total
The sum of frequencies across a row, representing the total count for a specific category of one variable.
Column Total
The sum of frequencies down a column, indicating the total count for a specific category of the second variable.
Grand Total
The overall sum of all frequencies in a table, representing the total sample size analyzed.
Cell
An intersection point in a table where a specific combination of categories from two variables is recorded.
Joint Probability
The likelihood of simultaneously observing two specific categories, calculated by multiplying their individual probabilities.
Frequency Distribution
A summary showing how often each category or combination occurs, extended to two variables in contingency tables.
Subtotal
A partial sum provided for rows or columns, aiding in quick calculation of totals within a table.
Sample Size
The total number of data points or individuals included in the analysis, forming the basis for frequency calculations.
Category
A distinct group or classification within a variable, such as height range or grade level, used for organizing data.
E Value
A shorthand for expected frequency in a cell, derived from the formula involving row, column, and grand totals.
 뒤로뒤로
뒤로뒤로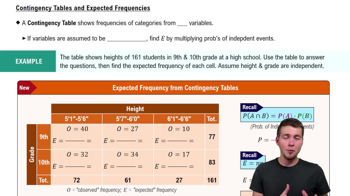
 08:18
08:18