Skip to main content
Statistics
나의 코스
배우기
시험 준비
AI 튜터
학습 가이드
교과서적 해결책
플래시카드
탐험해 보세요
앱을 사용해 보세요
나의 코스
배우기
시험 준비
AI 튜터
학습 가이드
교과서적 해결책
플래시카드
탐험해 보세요
앱을 사용해 보세요
뒤로
Describing Data Numerically Using a Graphing Calculator definitions
카드를 뒤집기 위해 탭할 수 있습니다.
TI-84 Calculator
카드를 뒤집기 위해 탭할 수 있습니다.
👆
TI-84 Calculator
A handheld device used to quickly compute descriptive statistics and summarize data for large datasets.
진행 상황 추적
컨트롤 버튼이 '내비게이션' 모드로 변경되었습니다.
1/15
관련 플래시카드
관련 실천
추천 영상
Describing Data Numerically Using a Graphing Calculator quiz #1
Describing Data Numerically Using a Graphing Calculator
22 용어
Describing Data Numerically Using a Graphing Calculator
3. Describing Data Numerically
4 문제점
주제
Zachary
Boxplots
3. Describing Data Numerically
5 문제점
주제
Brendan
3. Describing Data Numerically - Part 1 of 2
5 주제
15 문제점
장
David-Paige
3. Describing Data Numerically - Part 2 of 2
3 주제
8 문제점
장
Jonathan
05:45
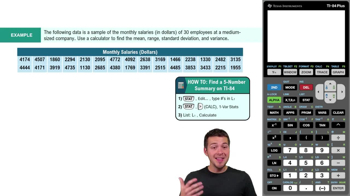
Find 5-Number Summary - TI-84 Calculator Example 1
1915
views
79
rank
3
comments
04:51
Find 5-Number Summary - TI-84 Calculator
3115
views
64
rank
이 집합의 용어 (15)
하이드의 정의
TI-84 Calculator
A handheld device used to quickly compute descriptive statistics and summarize data for large datasets.
Descriptive Statistics
Numerical measures that summarize and describe features of a dataset, aiding interpretation and analysis.
Mean
A value representing the average of all data points, calculated by summing values and dividing by their count.
Standard Deviation
A measure indicating how spread out data values are from the average, reflecting variability within the dataset.
Median
A value separating the higher half from the lower half of a dataset, providing a central tendency indicator.
Quartile
A value dividing a dataset into four equal parts, helping identify data distribution and spread.
First Quartile
A cutoff point below which 25% of the data values lie, marking the lower quarter of the dataset.
Third Quartile
A cutoff point below which 75% of the data values lie, marking the upper quarter of the dataset.
Five-Number Summary
A collection of five values—minimum, Q1, median, Q3, and maximum—offering a concise overview of data distribution.
Minimum
The smallest value in a dataset, indicating the lower boundary of the data range.
Maximum
The largest value in a dataset, indicating the upper boundary of the data range.
Data Distribution
The arrangement of values within a dataset, revealing patterns, spread, and central tendency.
Central Tendency
A characteristic describing the center or typical value of a dataset, often summarized by mean or median.
Variability
A feature reflecting how much data values differ from each other, often measured by standard deviation.
Sample
A subset of a population used for statistical analysis, often requiring specific calculations for measures like standard deviation.
 뒤로뒤로
뒤로뒤로

 05:45
05:45
