Skip to main content
Introductory Statistics
나의 코스
배우기
시험 준비
AI 튜터
학습 가이드
교과서적 해결책
플래시카드
탐험해 보세요
앱을 사용해 보세요
나의 코스
배우기
시험 준비
AI 튜터
학습 가이드
교과서적 해결책
플래시카드
탐험해 보세요
앱을 사용해 보세요
뒤로
Goodness of FIt Test Using TI-84 quiz
카드를 뒤집기 위해 탭할 수 있습니다.
What is the purpose of a goodness-of-fit test?
카드를 뒤집기 위해 탭할 수 있습니다.
👆
What is the purpose of a goodness-of-fit test?
A goodness-of-fit test compares observed frequencies to expected frequencies to determine if data fits a claimed distribution.
진행 상황 추적
컨트롤 버튼이 '내비게이션' 모드로 변경되었습니다.
1/15
관련 플래시카드
관련 실천
추천 영상
Goodness of FIt Test Using TI-84 definitions
Goodness of FIt Test Using TI-84
15 용어
13. Chi-Square Tests & Goodness of Fit
4 주제
5 문제점
장
VideoThumbView.guidedCourse
03:55
Goodness of Fit Test Using a TI-84 Example 2
185
views
2
rank
VideoThumbView.guidedCourse
02:50
Goodness of Fit Test Using a TI-84 Example 1
178
views
2
rank
VideoThumbView.guidedCourse
03:25
Goodness of Fit Test Using a TI-84 Example 3
164
views
5
rank
이 집합의 용어 (15)
하이드의 정의
What is the purpose of a goodness-of-fit test?
A goodness-of-fit test compares observed frequencies to expected frequencies to determine if data fits a claimed distribution.
How do you calculate expected values for equally distributed categories?
Expected values are calculated as e = n / k, where n is the sample size and k is the number of categories.
What is the formula for degrees of freedom in a goodness-of-fit test?
Degrees of freedom are calculated as k - 1, where k is the number of categories.
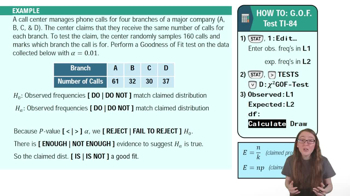
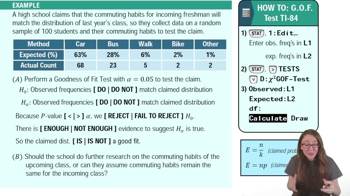
Where do you enter observed frequencies on the TI-84 for a GOF test?
Observed frequencies are entered in list L1 on the TI-84.
Where do you enter expected values on the TI-84 for a GOF test?
Expected values are entered in list L2 on the TI-84.
Which menu option on the TI-84 is used for the chi-square goodness-of-fit test?
Option D, the chi-square GOF test function, is used for the goodness-of-fit test.
What should you check in the TI-84 menu before running the GOF test?
Ensure observed is set to L1, expected is set to L2, and degrees of freedom match your problem.
What statistic does the TI-84 provide after running the GOF test?
The TI-84 provides the chi-square statistic, p-value, degrees of freedom, and contribution values.
What is the significance level (alpha) commonly used in hypothesis testing?
A common significance level is 0.05, or 5%.
How do you interpret a p-value greater than alpha in a GOF test?
If the p-value is greater than alpha, you fail to reject the null hypothesis, indicating the data fits the claimed distribution.
What does it mean to fail to reject the null hypothesis in a GOF test?
It means there is not enough evidence to conclude the observed frequencies do not match the claim distribution.
What is the null hypothesis in a goodness-of-fit test?
The null hypothesis states that observed frequencies match the claimed distribution.
What is the alternative hypothesis in a goodness-of-fit test?
The alternative hypothesis states that observed frequencies do not match the claimed distribution.
What are contribution values in the TI-84 GOF test output?
Contribution values show what each observed frequency contributes to the chi-square statistic.
What conclusion can you draw if flavor preferences are evenly distributed among categories?
If flavor preferences are evenly distributed, the claim distribution is a good fit for the observed data.
 뒤로뒤로
뒤로뒤로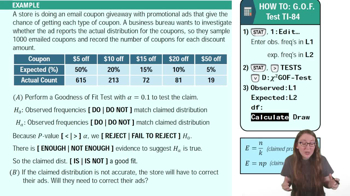
 03:55
03:55