Statistics
나의 코스
배우기
시험 준비
AI 튜터
학습 가이드
교과서적 해결책
플래시카드
탐험해 보세요
앱을 사용해 보세요
나의 코스
배우기
시험 준비
AI 튜터
학습 가이드
교과서적 해결책
플래시카드
탐험해 보세요
앱을 사용해 보세요
뒤로
Interpreting Standard Deviation definitions
카드를 뒤집기 위해 탭할 수 있습니다.
Standard Deviation
카드를 뒤집기 위해 탭할 수 있습니다.
👆
Standard Deviation
Quantifies how much data values differ from the mean, indicating the degree of spread or clustering in a dataset.
진행 상황 추적
컨트롤 버튼이 '내비게이션' 모드로 변경되었습니다.
1/15
관련 플래시카드
관련 실천
추천 영상
Interpreting Standard Deviation quiz #1
Interpreting Standard Deviation
10 용어
3. Describing Data Numerically
4 주제
11 문제점
장
David-Paige
05:42
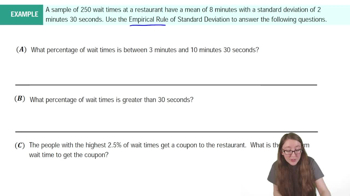
Empirical Rule of Standard Deviation and Range Rule of Thumb Example 1
2334
views
34
rank
01:56
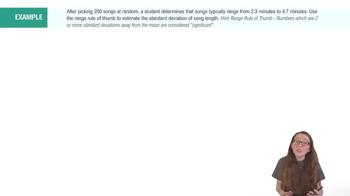
Empirical Rule of Standard Deviation and Range Rule of Thumb Example 2
1816
views
49
rank
07:10
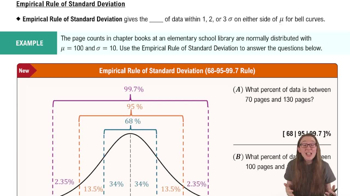
Empirical Rule of Standard Deviation and Range Rule of Thumb
5033
views
63
rank
이 집합의 용어 (15)
하이드의 정의
Standard Deviation
Quantifies how much data values differ from the mean, indicating the degree of spread or clustering in a dataset.
Mean
Represents the central value of a dataset, around which data points are distributed and compared.
Normal Distribution
Describes a symmetric, bell-shaped curve where data is evenly distributed around the mean.
Empirical Rule
Estimates the percentage of data within one, two, and three standard deviations of the mean in a normal distribution.
Bell Curve
Visualizes a normal distribution, showing symmetry and concentration of data around the mean.
Interval
Defines a range between two values, often measured in standard deviations from the mean.
Significance
Indicates a data value that is unusually high or low compared to the expected range in a dataset.
Range Rule of Thumb
Identifies values as significant if they are two or more standard deviations away from the mean.
Symmetry
Ensures equal distribution of data on both sides of the mean in a normal distribution.
Outlier
Refers to a data point that lies far from the mean, often outside two standard deviations.
Percentile
Expresses the proportion of data below a certain value, useful for interpreting spread in a normal distribution.
Clustering
Describes data points grouped closely together, often indicated by a small standard deviation.
Dispersion
Measures how widely data points are spread out from the mean, reflected by a large standard deviation.
Tail
Represents the extreme ends of a distribution, where significant or rare values are found.
Sixty-Eight Ninety-Five Ninety-Nine Point Seven Rule
Summarizes the empirical rule percentages for data within one, two, and three standard deviations of the mean.