Skip to main content
Introductory Statistics
나의 코스
배우기
시험 준비
AI 튜터
학습 가이드
교과서적 해결책
플래시카드
탐험해 보세요
앱을 사용해 보세요
나의 코스
배우기
시험 준비
AI 튜터
학습 가이드
교과서적 해결책
플래시카드
탐험해 보세요
앱을 사용해 보세요
뒤로
Multiple Comparisons: Bonferoni Test definitions
카드를 뒤집기 위해 탭할 수 있습니다.
One-way ANOVA
카드를 뒤집기 위해 탭할 수 있습니다.
👆
One-way ANOVA
Statistical method for comparing means across three or more groups using variance analysis from group and error sources.
진행 상황 추적
컨트롤 버튼이 '내비게이션' 모드로 변경되었습니다.
1/15
관련 플래시카드
관련 실천
추천 영상
Multiple Comparisons: Bonferoni Test quiz
Multiple Comparisons: Bonferoni Test
15 용어
Multiple Comparisons: Bonferoni Test
14. ANOVA
5 문제점
주제
Two-Way ANOVA
14. ANOVA
5 문제점
주제
Justin
14. ANOVA - Part 1 of 2
4 주제
12 문제점
장
Ally
14. ANOVA - Part 2 of 2
1 주제
3 문제점
장
Justin
VideoThumbView.guidedCourse
08:11
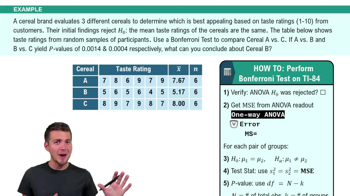
The Bonferroni Test Example 1
173
views
3
rank
VideoThumbView.guidedCourse
09:54
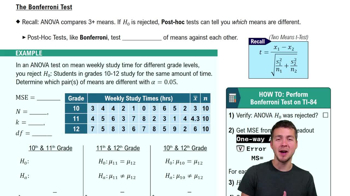
The Bonferroni Test
221
views
2
rank
1
comments
이 집합의 용어 (15)
하이드의 정의
One-way ANOVA
Statistical method for comparing means across three or more groups using variance analysis from group and error sources.
Null Hypothesis
Assumption that all group means are equal, serving as the baseline for statistical testing in variance analysis.
Post Hoc Test
Procedure applied after rejecting the baseline assumption to identify which group means differ significantly.
Bonferroni Test
Pairwise comparison method that adjusts error rates by multiplying p-values or dividing significance level by the number of comparisons.
Mean Square Error
Value from variance analysis representing within-group variability, used in calculating test statistics for comparisons.
Sample Size
Count of observations in each group, influencing calculations for test statistics and degrees of freedom.
Degrees of Freedom
Number derived from total observations minus groups, used in determining statistical significance and p-values.
Pairwise Comparison
Analysis of differences between every possible pair of group means to pinpoint significant disparities.
T Score
Statistic calculated from sample means, variability, and sizes, indicating the magnitude of difference between groups.
P Value
Probability measure indicating the likelihood of observing a result as extreme as the test statistic under the baseline assumption.
Adjusted P Value
Probability measure modified to account for multiple comparisons, controlling the overall error rate in the experiment.
Significance Level
Threshold for determining statistical significance, often set at 0.05, compared against adjusted probability measures.
Bonferroni Correction
Technique for controlling experiment-wide error by multiplying probability measures or dividing the threshold by the number of comparisons.
Combinatorial Function
Mathematical operation used to calculate the number of possible pairs among groups for comparison purposes.
Alternative Hypothesis
Statement asserting that at least one group mean differs, guiding the direction of statistical testing after baseline rejection.
 뒤로뒤로
뒤로뒤로
 08:11
08:11