Skip to main content
Introductory Statistics
나의 코스
배우기
시험 준비
AI 튜터
학습 가이드
교과서적 해결책
플래시카드
탐험해 보세요
앱을 사용해 보세요
나의 코스
배우기
시험 준비
AI 튜터
학습 가이드
교과서적 해결책
플래시카드
탐험해 보세요
앱을 사용해 보세요
뒤로
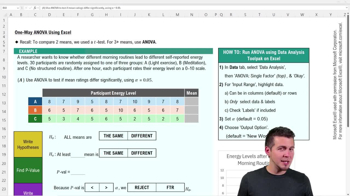
One-Way ANOVA - Excel definitions
카드를 뒤집기 위해 탭할 수 있습니다.
ANOVA
카드를 뒤집기 위해 탭할 수 있습니다.
👆
ANOVA
A statistical method for comparing means across three or more groups using variance analysis to detect significant differences.
진행 상황 추적
컨트롤 버튼이 '내비게이션' 모드로 변경되었습니다.
1/15
관련 플래시카드
관련 실천
추천 영상
One-Way ANOVA - Excel quiz
One-Way ANOVA - Excel
15 용어
Multiple Comparisons: Tukey Test
14. ANOVA
5 문제점
주제
14. ANOVA - Part 1 of 2
4 주제
12 문제점
장
Ally
14. ANOVA - Part 2 of 2
1 주제
3 문제점
장
Justin
VideoThumbView.guidedCourse
05:52
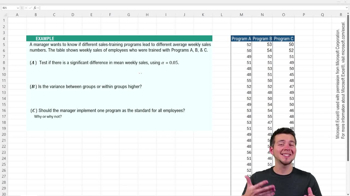
One-Way ANOVA Using Excel Example 1
132
views
2
rank
VideoThumbView.guidedCourse
07:05
One-Way ANOVA Using Excel
139
views
2
rank
1
comments
이 집합의 용어 (15)
하이드의 정의
ANOVA
A statistical method for comparing means across three or more groups using variance analysis to detect significant differences.
Null Hypothesis
The assumption that all group means are equal, serving as the starting point for statistical testing in variance analysis.
Alternative Hypothesis
The proposition that at least one group mean differs from the others, indicating a significant difference in the data.
F Statistic
A value calculated as the ratio of mean square between groups to mean square within groups, used to assess group differences.
P Value
A probability measure indicating the likelihood of observing the data if the null hypothesis is true; a low value suggests significance.
Alpha
A threshold for statistical significance, commonly set at 0.05, used to decide whether to reject the null hypothesis.
Mean Square Between
A measure of variance reflecting how much group averages differ from the overall mean in variance analysis.
Mean Square Within
A measure of variance showing how much individual values within each group deviate from their group mean.
Data Analysis Tool Pack
An Excel feature providing statistical tools, including ANOVA, for analyzing datasets and generating test statistics.
Input Range
The selection of data in Excel that specifies which values are included in the statistical analysis.
Output Option
A setting in Excel determining where the results of the statistical analysis will be displayed or stored.
Source of Variation
Categories in ANOVA output that distinguish between variance due to group differences and variance within groups.
Group Mean
The average value calculated for each group in a dataset, used to compare differences in ANOVA.
Variance Between Groups
A measure of how much the group means differ from each other, central to detecting significant differences.
Variance Within Groups
A measure of how much individual data points in each group differ from their respective group mean.
 뒤로뒤로
뒤로뒤로
 05:52
05:52