Statistics
나의 코스
배우기
시험 준비
AI 튜터
학습 가이드
교과서적 해결책
플래시카드
탐험해 보세요
앱을 사용해 보세요
나의 코스
배우기
시험 준비
AI 튜터
학습 가이드
교과서적 해결책
플래시카드
탐험해 보세요
앱을 사용해 보세요
뒤로
Steps in Hypothesis Testing definitions
카드를 뒤집기 위해 탭할 수 있습니다.
Null Hypothesis
카드를 뒤집기 위해 탭할 수 있습니다.
👆
Null Hypothesis
A default claim about a population parameter, always written with an equal sign and used as the basis for comparison in hypothesis testing.
진행 상황 추적
컨트롤 버튼이 '내비게이션' 모드로 변경되었습니다.
1/15
관련 플래시카드
관련 실천
추천 영상
Steps in Hypothesis Testing quiz #1
Steps in Hypothesis Testing
37 용어
Steps in Hypothesis Testing quiz #2
Steps in Hypothesis Testing
38 용어
Steps in Hypothesis Testing quiz #3
Steps in Hypothesis Testing
14 용어
Steps in Hypothesis Testing
9. Hypothesis Testing for One Sample
7 문제점
주제

Ally
9. Hypothesis Testing for One Sample
1 주제
3 문제점
장
David-Paige
VideoThumbView.guidedCourse
09:56
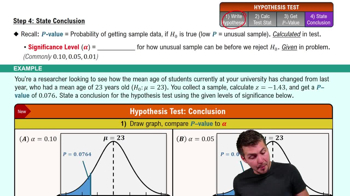
Step 4: State Conclusion
1694
views
29
rank
VideoThumbView.guidedCourse
06:34
Step 2: Calculate Test Statistic
3016
views
77
rank
2
comments
VideoThumbView.guidedCourse
06:21
Step 1: Write Hypotheses
4153
views
130
rank
2
comments
이 집합의 용어 (15)
하이드의 정의
Null Hypothesis
A default claim about a population parameter, always written with an equal sign and used as the basis for comparison in hypothesis testing.
Alternative Hypothesis
An opposing claim to the default assumption, expressed with less than, greater than, or not equal symbols, representing what evidence is sought.
Population
The entire group under study, about which claims are made and tested using sample data.
Sample
A subset of the population, used to collect data and infer characteristics about the larger group.
Parameter
A numerical value describing a characteristic of the population, such as mean, proportion, or standard deviation.
Test Statistic
A calculated value, often a z or t score, quantifying how different the sample data is from the claimed population parameter.
Z Score
A standardized value indicating how many standard deviations a sample statistic is from the assumed population mean.
T Score
A standardized value used when the population standard deviation is unknown, measuring sample deviation from the mean.
P Value
A probability representing how likely the observed sample data is, assuming the default claim about the population is true.
Significance Level
A threshold, commonly 0.05, used to determine how unusual a sample must be before rejecting the default claim.
Critical Region
The area in a distribution where, if the p value falls within, the default claim is rejected due to the sample being too unusual.
Left-Tailed Test
A hypothesis test where the alternative claim uses a less than symbol, and the p value is the area to the left of the test statistic.
Right-Tailed Test
A hypothesis test where the alternative claim uses a greater than symbol, and the p value is the area to the right of the test statistic.
Two-Tailed Test
A hypothesis test where the alternative claim uses a not equal symbol, and the p value covers both extremes of the distribution.
Sample Mean
The average value calculated from the sample, used to compare against the population mean in hypothesis testing.