Skip to main content
Introductory Statistics
나의 코스
배우기
시험 준비
AI 튜터
학습 가이드
교과서적 해결책
플래시카드
탐험해 보세요
앱을 사용해 보세요
나의 코스
배우기
시험 준비
AI 튜터
학습 가이드
교과서적 해결책
플래시카드
탐험해 보세요
앱을 사용해 보세요
뒤로
Two Means - Matched Pairs (Dependent Samples) definitions
카드를 뒤집기 위해 탭할 수 있습니다.
Matched Pairs
카드를 뒤집기 위해 탭할 수 있습니다.
👆
Matched Pairs
Samples uniquely related, often through before-and-after comparisons, with each value paired in a one-to-one relationship.
진행 상황 추적
컨트롤 버튼이 '내비게이션' 모드로 변경되었습니다.
1/15
관련 플래시카드
관련 실천
추천 영상
Two Means - Matched Pairs (Dependent Samples) quiz #1
Two Means - Matched Pairs (Dependent Samples)
10 용어
Two Means - Matched Pairs (Dependent Samples)
10. Hypothesis Testing for Two Samples
3 문제점
주제
Brendan
10. Hypothesis Testing for Two Samples - Part 1 of 2
5 주제
12 문제점
장
Brendan
10. Hypothesis Testing for Two Samples - Part 2 of 2
1 주제
2 문제점
장
Ernest
VideoThumbView.guidedCourse
07:23
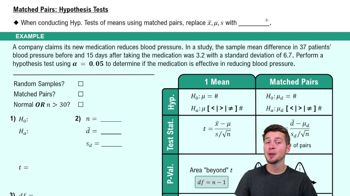
Matched Pairs: Hypothesis Tests
618
views
5
rank
VideoThumbView.guidedCourse
07:19
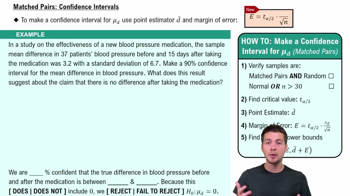
Matched Pairs: Confidence Intervals
611
views
1
rank
VideoThumbView.guidedCourse
08:33
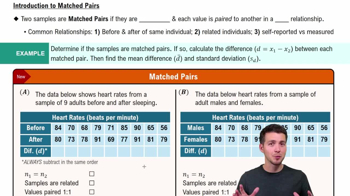
Introduction to Matched Pairs
843
views
14
rank
이 집합의 용어 (15)
하이드의 정의
Matched Pairs
Samples uniquely related, often through before-and-after comparisons, with each value paired in a one-to-one relationship.
Dependent Samples
Groups where values are linked, such as repeated measures on the same individuals, affecting each other's outcomes.
Mean Difference
Average of the differences calculated between paired values, serving as the point estimator in analysis.
Standard Deviation of the Difference
Measure of variability among the differences in matched pairs, used in margin of error calculations.
Null Hypothesis
Default assumption stating no difference exists between paired values, often set to zero in matched pairs tests.
Alternative Hypothesis
Statement suggesting a significant change or difference between paired values, guiding the direction of the test.
Confidence Interval
Range constructed around the mean difference, indicating where the true population difference likely falls.
Margin of Error
Amount added and subtracted from the mean difference, calculated using the critical t-value and standard deviation.
Critical t-value
Threshold from the t-distribution, determined by confidence level and degrees of freedom, used in interval and error calculations.
Degrees of Freedom
Value found by subtracting one from the number of pairs, influencing the shape of the t-distribution.
Point Estimator
Best guess for the population mean difference, typically the sample mean difference in matched pairs analysis.
One-to-One Relationship
Direct pairing of values from two samples, ensuring each value is uniquely matched for comparison.
Random Sample
Selection process ensuring each individual has an equal chance of inclusion, supporting valid statistical inference.
p-value
Probability of observing results as extreme as those found, given the null hypothesis is true, used for decision-making.
Level of Significance
Threshold for deciding whether to reject the null hypothesis, commonly set at 0.05 in hypothesis testing.
 뒤로뒤로
뒤로뒤로

 07:23
07:23