Statistics
나의 코스
배우기
시험 준비
AI 튜터
학습 가이드
교과서적 해결책
플래시카드
탐험해 보세요
앱을 사용해 보세요
나의 코스
배우기
시험 준비
AI 튜터
학습 가이드
교과서적 해결책
플래시카드
탐험해 보세요
앱을 사용해 보세요
뒤로
Two Means - Unknown, Equal Variance quiz
카드를 뒤집기 위해 탭할 수 있습니다.
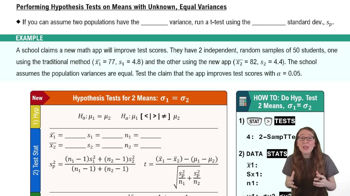
What assumption allows us to use the pooled standard deviation in a two means hypothesis test?
카드를 뒤집기 위해 탭할 수 있습니다.
👆
What assumption allows us to use the pooled standard deviation in a two means hypothesis test?
We assume that the two populations have equal variances, which allows us to use the pooled standard deviation.
진행 상황 추적
컨트롤 버튼이 '내비게이션' 모드로 변경되었습니다.
1/15
관련 플래시카드
관련 실천
추천 영상
Two Means - Unknown, Equal Variance definitions
Two Means - Unknown, Equal Variance
15 용어
10. Hypothesis Testing for Two Samples
3 주제
6 문제점
장
Brendan
06:20
Means Unknown Equal Variances Hypothesis Test Using TI-84
376
views
1
rank
03:34
Means Unknown Equal Variances Hypothesis Test Using TI-84 Example 2
159
views
1
rank
03:10
Means Unknown Equal Variances Hypothesis Test Using TI-84 Example 1
170
views
이 집합의 용어 (15)
하이드의 정의
What assumption allows us to use the pooled standard deviation in a two means hypothesis test?
We assume that the two populations have equal variances, which allows us to use the pooled standard deviation.
How is the pooled standard deviation calculated?
It is calculated as a weighted average of the two sample variances, providing a better approximation for the population standard deviation.
What is the null hypothesis when testing two means with equal variances?
The null hypothesis is that the two population means are equal, or mu1 = mu2.
What is the alternative hypothesis if you want to test if a new method improves scores?
The alternative hypothesis is that the mean of the old method is less than the mean of the new method, or mu1 < mu2.
What information do you need from each sample to perform the test?
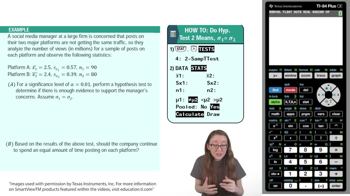
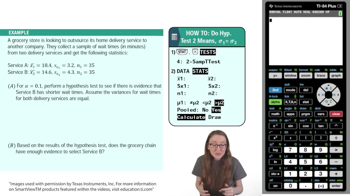
You need the sample mean, sample standard deviation, and sample size from each group.
What changes in the t-score formula when using pooled standard deviation?
The denominator uses the pooled standard deviation instead of the individual sample standard deviations.
How do you find the degrees of freedom for this test?
Add the sample sizes of both groups, subtract one from each, and sum the results: (n1 - 1) + (n2 - 1).
What is the next step after calculating the t-score?
Turn the t-score into a p-value using a t-table or calculator.
How do you determine whether to reject the null hypothesis?
Compare the p-value to the significance level (alpha); if the p-value is less than alpha, reject the null hypothesis.
What does rejecting the null hypothesis indicate in this context?
It indicates there is enough evidence to support the alternative hypothesis, such as improved test scores with the new method.
What sample size condition must be met for valid results?
Each sample size should be greater than 30 to satisfy normality assumptions.
What type of samples are required for this test?
Independent random samples are required.
What is the significance level (alpha) used in the example?
The significance level used is 0.05.
What was the calculated t value in the example provided?
The t value calculated was approximately -5.43.
What was the p-value obtained in the example, and what does it mean?
The p-value was approximately 2.05 x 10^-7, which is much less than alpha, so the null hypothesis is rejected.