Skip to main content
Introductory Statistics
나의 코스
배우기
시험 준비
AI 튜터
학습 가이드
교과서적 해결책
플래시카드
탐험해 보세요
앱을 사용해 보세요
나의 코스
배우기
시험 준비
AI 튜터
학습 가이드
교과서적 해결책
플래시카드
탐험해 보세요
앱을 사용해 보세요
뒤로
Two Variances - Graphing Calculator quiz
카드를 뒤집기 위해 탭할 수 있습니다.
What is the purpose of a two-sample F test for variance?
카드를 뒤집기 위해 탭할 수 있습니다.
👆
What is the purpose of a two-sample F test for variance?
It compares sample standard deviations to test hypotheses about population variances.
진행 상황 추적
컨트롤 버튼이 '내비게이션' 모드로 변경되었습니다.
1/15
관련 플래시카드
관련 실천
추천 영상
Two Variances - Graphing Calculator definitions
Two Variances - Graphing Calculator
15 용어
Two Variances and F Distribution
10. Hypothesis Testing for Two Samples
5 문제점
주제
Ernest
10. Hypothesis Testing for Two Samples - Part 1 of 2
5 주제
12 문제점
장
Brendan
10. Hypothesis Testing for Two Samples - Part 2 of 2
1 주제
2 문제점
장
Ernest
VideoThumbView.guidedCourse
07:07
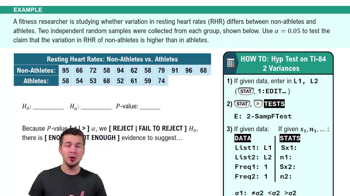
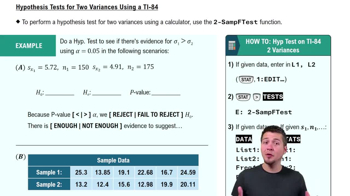
Hypothesis Test for Two Variances Using a TI-84
156
views
VideoThumbView.guidedCourse
05:09
Hypothesis Test for Two Variances Using a TI-84 Example 1
103
views
이 집합의 용어 (15)
하이드의 정의
What is the purpose of a two-sample F test for variance?
It compares sample standard deviations to test hypotheses about population variances.
What is the typical null hypothesis in a two-sample F test for variance?
The null hypothesis usually states that σ1 equals σ2.
What does the alternative hypothesis represent in a two-sample F test?
It reflects the claim being tested, such as σ1 > σ2.
What significance level (alpha) was used in the example problems?
Alpha was set at 0.05 in both example scenarios.
What are the two main ways to input data into the graphing calculator for the F test?
You can input either sample statistics or raw data.
Which calculator menu do you use to access the two-sample F test?
You use the stat menu and then go to the tests tab.
What four inputs are required when entering sample statistics for the F test?
You need s1, s2, n1, and n2.
How do you decide which sample is s1 when entering statistics?
s1 should be the sample with the larger standard deviation.
What two values does the calculator provide after running the F test?
It provides the F statistic and the p-value.
What does a p-value less than alpha indicate in the F test?
It means you reject the null hypothesis, indicating significant variance differences.
What is the conclusion if the p-value is greater than alpha?
You fail to reject the null hypothesis, meaning there is not enough evidence for the alternative.
How do you input raw data for the F test on a graphing calculator?
Enter the data into lists L1 and L2, then select the data tab in the F test menu.
What should you check when entering data for the F test?
Ensure sample one and sample two are correctly labeled as L1 and L2.
What type of test should you select if the claim is σ1 > σ2?
You should select a right-tailed test.
What is the main advantage of using the two-sample F test function on a graphing calculator?
It streamlines hypothesis testing for variance, making the process faster and more accurate.
 뒤로뒤로
뒤로뒤로

 07:07
07:07