Skip to main content
Statistics
나의 코스
배우기
시험 준비
AI 튜터
학습 가이드
교과서적 해결책
플래시카드
탐험해 보세요
앱을 사용해 보세요
나의 코스
배우기
시험 준비
AI 튜터
학습 가이드
교과서적 해결책
플래시카드
탐험해 보세요
앱을 사용해 보세요
뒤로
Estimating Parameters and Confidence Intervals in Statistics
카드를 뒤집기 위해 탭할 수 있습니다.
What is a parameter in statistics?
카드를 뒤집기 위해 탭할 수 있습니다.
👆
What is a parameter in statistics?
Parameter
is a numerical summary of a population.
진행 상황 추적
컨트롤 버튼이 '내비게이션' 모드로 변경되었습니다.
1/20
추천 영상
04:46
Critical Values: z Scores
2840
views
54
rank
06:33
Introduction to Confidence Intervals
4419
views
102
rank
이 집합의 용어 (20)
하이드의 정의
What is a parameter in statistics?
Parameter
is a numerical summary of a population.
What is a statistic in statistics?
Statistic
is any numerical measure computed from a subset of the population, typically a sample.
What is the difference between a point estimator and an interval estimator?
A
point estimator
estimates a parameter by a single value, while an
interval estimator
estimates by an interval of values (single value ± error).
What is the point estimate of the population mean (𝜇)?
The point estimate of the population mean 𝜇 is the sample mean \(\bar{x}\).
Define confidence interval (CI).
A
confidence interval
is a range of values obtained from a point estimate that likely contains the true population parameter.
What does the confidence level represent?
The
confidence level
is the probability that the true parameter lies within the confidence interval, denoted as (1 − 𝛼).
What are the most common confidence levels and their corresponding 𝛼 values?
Common confidence levels: 90% (𝛼=0.10), 95% (𝛼=0.05), 99% (𝛼=0.01).
How is the margin of error (E) related to the confidence interval?
The
margin of error
is half the length of the confidence interval and indicates the precision of the estimate.
Formula for a confidence interval for a population proportion 𝑝.
\(\hat{p} - z_{\alpha/2} \sqrt{\frac{\hat{p}(1-\hat{p})}{n}} < p < \hat{p} + z_{\alpha/2} \sqrt{\frac{\hat{p}(1-\hat{p})}{n}}\)
What are the requirements for estimating a population proportion?
Requirements: simple random sample, binomial conditions met, at least 5 successes and 5 failures (np≥5 and nq≥5).
How to find the point estimate and margin of error from a confidence interval?
Point estimate: average of upper and lower limits; Margin of error: half the difference between upper and lower limits.
Formula to determine sample size when estimating population proportion with known estimate 𝑝̂.
\(n = \left( \frac{Z_{\alpha/2}^2 \hat{p}(1-\hat{p})}{E^2} \right)\)
Formula to determine sample size when no estimate of 𝑝̂ is known.
\(n = \left( \frac{Z_{\alpha/2}^2 \times 0.25}{E^2} \right)\)
What is the best point estimate of the population mean 𝜇 when 𝜎 is unknown?
The sample mean \(\bar{x}\) is the best point estimate of 𝜇.
What distribution is used when estimating a population mean with unknown 𝜎?
The
Student's t-distribution
with (n-1) degrees of freedom is used.
Formula for the confidence interval for population mean 𝜇 with unknown 𝜎.
\(\bar{x} - t_{\alpha/2} \frac{s}{\sqrt{n}} < \mu < \bar{x} + t_{\alpha/2} \frac{s}{\sqrt{n}}\)
What are the conditions for using the t-distribution confidence interval?
Conditions: simple random sample, population normal or sample size n > 30.
How does the Student t-distribution compare to the standard normal distribution?
The t-distribution is symmetric like normal but has heavier tails; it approaches normal as sample size increases.
Formula to determine sample size for estimating a population mean 𝜇.
\(n = \left( \frac{Z_{\alpha/2} \sigma}{E} \right)^2\)
How does increasing the confidence level affect the confidence interval width?
Increasing confidence level increases the width of the confidence interval, making it less precise but more reliable.
 뒤로뒤로
뒤로뒤로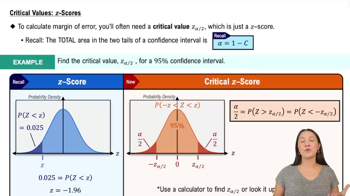
 04:46
04:46
