Ch. 10 - Chi-Square Tests and the F-Distribution
Larson - Elementary Statistics: Picturing the World 8th Edition
Larson8th EditionElementary Statistics: Picturing the WorldISBN: 9780137493470당신이 사용하는 게 아니라요?교과서 변경
10장, 문제 10.3.14

"In Exercises 13–18, test the claim about the difference between two population variances σ₁² and σ₂² at the level of significance α. Assume the samples are random and independent, and the populations are normally distributed.


Claim: σ₁² = σ₂²; α = 0.05.
Sample statistics: s₁² = 310, n₁ = 7 and s₂² = 297, n₂ = 8"

검증된 단계별 안내
1
Step 1: Identify the null and alternative hypotheses. The null hypothesis (H₀) states that the population variances are equal: H₀: σ₁² = σ₂². The alternative hypothesis (H₁) states that the population variances are not equal: H₁: σ₁² ≠ σ₂². This is a two-tailed test.
Step 2: Calculate the test statistic using the formula for the F-test: F = (s₁² / s₂²), where s₁² and s₂² are the sample variances. Plug in the given values: s₁² = 310 and s₂² = 297.
Step 3: Determine the degrees of freedom for each sample. For the numerator (df₁), the degrees of freedom are n₁ - 1, and for the denominator (df₂), the degrees of freedom are n₂ - 1. Use the given sample sizes n₁ = 7 and n₂ = 8 to calculate df₁ and df₂.
Step 4: Find the critical values for the F-distribution at the given significance level α = 0.05. Since this is a two-tailed test, divide α by 2 for each tail (α/2 = 0.025). Use the F-distribution table or statistical software to find the critical values corresponding to df₁ and df₂.
Step 5: Compare the calculated F-test statistic to the critical values. If the test statistic falls outside the range defined by the critical values, reject the null hypothesis (H₀). Otherwise, fail to reject the null hypothesis. Interpret the result in the context of the claim.

비슷한 문제에 대한 검증된 영상 답변:

이 영상 해법은 위 문제에 도움이 된다고 튜터들이 추천한 것입니다.
영상 길이:
3m
도움이 되었나요?

주요 개념

질문에 올바르게 답하기 위해 반드시 이해해야 하는 핵심 개념들은 다음과 같습니다.

Hypothesis Testing

Hypothesis testing is a statistical method used to make decisions about population parameters based on sample data. In this context, we are testing the null hypothesis (H₀) that the variances of two populations are equal (σ₁² = σ₂²) against the alternative hypothesis (H₁) that they are not equal. The outcome of this test helps determine if there is enough evidence to reject the null hypothesis at a specified significance level.
추천 영상:
05:52
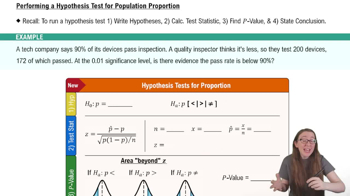
Performing Hypothesis Tests: Proportions

F-Test for Variances

The F-test is a statistical test used to compare the variances of two populations. It involves calculating the F-statistic, which is the ratio of the two sample variances (s₁²/s₂²). This statistic follows an F-distribution under the null hypothesis, and by comparing the calculated F-statistic to a critical value from the F-distribution table, we can assess whether to reject or fail to reject the null hypothesis regarding the equality of variances.
추천 영상:
가이드 코스
04:48
Variance & Standard Deviation of Discrete Random Variables

Significance Level (α)

The significance level, denoted as α, is the probability of rejecting the null hypothesis when it is actually true (Type I error). In this case, α is set at 0.05, meaning there is a 5% risk of concluding that the variances are different when they are not. This threshold helps determine the critical value for the F-test and guides the decision-making process in hypothesis testing.
추천 영상:
03:33
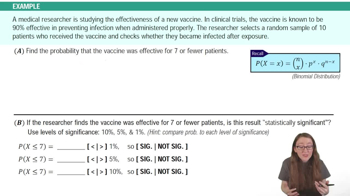
Finding Binomial Probabilities Using TI-84 Example 1
관련 실천
교과서 질문

Performing a Two-Sample F-Test In Exercises 19–26, (a) identify the claim and state H0 and Ha, (b) find the critical value and identify the rejection region, (c) find the test statistic F, (d) decide whether to reject or fail to reject the null hypothesis, and (e) interpret the decision in the context of the original claim. Assume the samples are random and independent, and the populations are normally distributed.


Heart Transplant Waiting Times The table at the left shows a sample of the waiting times (in days) for a heart transplant for two age groups. At α=0.05, can you conclude that the variances of the waiting times differ between the two age groups? (Adapted from Organ Procurement and Transplantation Network)


41
views
교과서 질문

Finding Expected Frequencies

In Exercises 7–12, (a) calculate the marginal frequencies and (b) find the expected frequency for each cell in the contingency table. Assume that the variables are independent.


111
views
교과서 질문

Performing a Two-Sample F-Test In Exercises 19–26, (a) identify the claim and state H0 and Ha, (b) find the critical value and identify the rejection region, (c) find the test statistic F, (d) decide whether to reject or fail to reject the null hypothesis, and (e) interpret the decision in the context of the original claim. Assume the samples are random and independent, and the populations are normally distributed.


Annual Salaries An employment information service claims that the standard deviation of the annual salaries for public relations managers is less in Louisiana than in Florida. You select a sample of public relations managers from each state. The results of each survey are shown in the figure. At α=0.05, can you support the service’s claim? (Adapted from America’s Career InfoNet)


47
views
교과서 질문

Explain how to find the critical value for an F-test.

448
views
교과서 질문

Testing for Normality Using a chi-square goodness-of-fit test, you can decide, with some degree of certainty, whether a variable is normally distributed. In all chi-square tests for normality, the null and alternative hypotheses are as listed below.


H₀: The variable has a normal distribution.


Hₐ: The variable does not have a normal distribution.


To determine the expected frequencies when performing a chi-square test for normality, first estimate the mean and standard deviation of the frequency distribution. Then, use the mean and standard deviation to compute the z-score for each class boundary. Then, use the z-scores to calculate the area under the standard normal curve for each class. Multiplying the resulting class areas by the sample size yields the expected frequency for each class.In Exercises 17 and 18, (a) find the expected frequencies, (b) find the critical value and identify the rejection region, (c) find the chi-square test statistic, (d) decide whether to reject or fail to reject the null hypothesis, and (e) interpret the decision in the context of the original claim.


In Exercises 17 and 18, (a) find the expected frequencies, (b) find the critical value and identify the rejection region, (c) find the chi-square test statistic, (d) decide whether to reject or fail to reject the null hypothesis, and (e) interpret the decision in the context of the original claim.


Test Scores At α=0.01, test the claim that the 200 test scores shown in the frequency distribution are normally distributed.


280
views
교과서 질문

True or False? In Exercises 5 and 6, determine whether the statement is true or false. If it is false, rewrite it as a true statement.


When the test statistic for the chi-square independence test is large, you will, in most cases, reject the null hypothesis.

69
views