
Ch. 10 - Chi-Square Tests and the F-Distribution
Larson - Elementary Statistics: Picturing the World 8th Edition
Larson8th EditionElementary Statistics: Picturing the WorldISBN: 9780137493470당신이 사용하는 게 아니라요?교과서 변경
10장, 문제 10.4.1

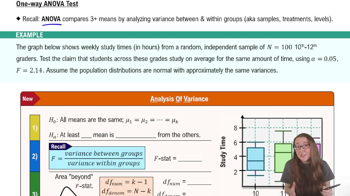
State the null and alternative hypotheses for a one-way ANOVA test.

검증된 단계별 안내
1
Understand the purpose of a one-way ANOVA test: It is used to determine whether there are statistically significant differences between the means of three or more independent groups.
Define the null hypothesis (H₀): The null hypothesis states that all group means are equal. In mathematical terms, H₀: μ₁ = μ₂ = μ₃ = ... = μₖ, where μ represents the population mean for each group and k is the number of groups.
Define the alternative hypothesis (Hₐ): The alternative hypothesis states that at least one group mean is different from the others. In mathematical terms, Hₐ: Not all μ₁, μ₂, ..., μₖ are equal.
Recognize that the hypotheses are tested using the F-statistic, which compares the variance between group means to the variance within groups.
Ensure clarity in stating the hypotheses: The null hypothesis represents no effect or no difference, while the alternative hypothesis represents the presence of a difference among group means.

비슷한 문제에 대한 검증된 영상 답변:

이 영상 해법은 위 문제에 도움이 된다고 튜터들이 추천한 것입니다.
영상 길이:
4m
도움이 되었나요?

주요 개념

질문에 올바르게 답하기 위해 반드시 이해해야 하는 핵심 개념들은 다음과 같습니다.

Null Hypothesis (H0)

The null hypothesis (H0) in a one-way ANOVA test posits that there are no significant differences among the group means being compared. It serves as a baseline assumption that any observed differences are due to random chance rather than a true effect. In the context of ANOVA, H0 states that all group means are equal.
추천 영상:
가이드 코스
06:21
Step 1: Write Hypotheses

Alternative Hypothesis (H1)

The alternative hypothesis (H1) in a one-way ANOVA test suggests that at least one group mean is different from the others. This hypothesis is what researchers aim to support through their analysis, indicating that there is a statistically significant effect of the independent variable on the dependent variable. H1 is accepted if the evidence suggests that the null hypothesis can be rejected.
추천 영상:
가이드 코스
06:21
Step 1: Write Hypotheses

One-Way ANOVA

One-way ANOVA (Analysis of Variance) is a statistical method used to compare means across three or more groups based on one independent variable. It assesses whether the means of different groups are statistically significantly different from each other. The test calculates an F-statistic, which helps determine if the observed variance among group means is greater than the variance within the groups, indicating a potential effect of the independent variable.
추천 영상:
관련 실천
교과서 질문

"Using Technology to Perform a Two-Way ANOVA Test In Exercises 15–18, use technology and the block design to perform a two-way ANOVA test. Use α=0.10. Interpret the results. Assume the samples are random and independent, the populations are normally distributed, and the population variances are equal.


[APPLET] Laptop Repairs The manager of a computer repair service wants to determine whether there is a difference in the time it takes four technicians to repair different brands of laptops. The block design shows the times (in minutes) it took for each technician to repair three laptops of each brand.

48
views
교과서 질문

Finding Expected Frequencies

In Exercises 3–6, find the expected frequency for the values of n and pᵢ.


n=230, pᵢ=0.25

118
views
교과서 질문

Finding Expected Frequencies

In Exercises 3–6, find the expected frequency for the values of n and pᵢ.


n=415, pᵢ=0.08

126
views
교과서 질문

"Finding a Critical F-Value for a Two-Tailed Test In Exercises 9–12, find the critical F-value for a two-tailed test using the level of significance α and degrees of freedom d.f.N and d.f.D.


α=0.10, d.f.N=24, d.f.D=28"

88
views
교과서 질문

Performing a Chi-Square Independence Test In Exercises 13–28, perform the indicated chi-square independence test by performing the steps below.

a. Identify the claim and state H₀ and Hₐ


b. Determine the degrees of freedom, find the critical value, and identify the rejection region.


c. Find the chi-square test statistic.


d. Decide whether to reject or fail to reject the null hypothesis.


e. Interpret the decision in the context of the original claim.


Alcohol-Related Accidents The contingency table shows the results of a random sample of fatally injured passenger vehicle drivers (with blood alcohol concentrations greater than or equal to 0.08) by age and gender. At α=0.05, can you conclude that age is related to gender in such alcohol-related accidents? (Adapted from Insurance Institute for Highway Safety)

55
views
교과서 질문

In Exercises 13–18, test the claim about the difference between two population variances σ₁² and σ₂² at the level of significance α. Assume the samples are random and independent, and the populations are normally distributed.


Claim: σ₁² ≠ σ₂²; α = 0.05.

Sample statistics: s₁² = 245, n₁ = 31 and s₂² = 112, n₂ = 28

46
views