



Ch. 2 - Descriptive Statistics
Larson - Elementary Statistics: Picturing the World 8th Edition
Larson8th EditionElementary Statistics: Picturing the WorldISBN: 9780137493470당신이 사용하는 게 아니라요?교과서 변경
2장, 문제 2.5.53

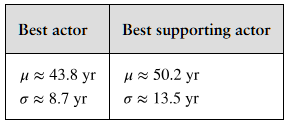
Comparing z-Scores from Different Data Sets The table shows population statistics for the ages of Best Actor and Best Supporting Actor winners at the Academy Awards from 1929 to 2020. The distributions of the ages are approximately bell-shaped. In Exercises 51–54, compare the z-scores for the actors.


tab


Best Actor 1970: John Wayne, Age: 62
Best Supporting Actor 1970: Gig Young, Age: 56

검증된 단계별 안내
1
Step 1: Understand the z-score formula. The z-score is calculated using the formula: z=x-μσ, where x is the observed value, μ is the mean, and σ is the standard deviation.
Step 2: Identify the values for Best Actor (John Wayne). The observed age is 62 years, the mean age μ is approximately 43.8 years, and the standard deviation σ is approximately 8.7 years.
Step 3: Calculate the z-score for Best Actor using the formula: z=62-43.88.7. Simplify the numerator and divide by the standard deviation.
Step 4: Identify the values for Best Supporting Actor (Gig Young). The observed age is 56 years, the mean age μ is approximately 50.2 years, and the standard deviation σ is approximately 13.5 years.
Step 5: Calculate the z-score for Best Supporting Actor using the formula: z=56-50.213.5. Simplify the numerator and divide by the standard deviation.

비슷한 문제에 대한 검증된 영상 답변:

이 영상 해법은 위 문제에 도움이 된다고 튜터들이 추천한 것입니다.
영상 길이:
3m
도움이 되었나요?

주요 개념

질문에 올바르게 답하기 위해 반드시 이해해야 하는 핵심 개념들은 다음과 같습니다.

Z-Score

A z-score measures how many standard deviations an individual data point is from the mean of a dataset. It is calculated by subtracting the mean from the data point and then dividing by the standard deviation. Z-scores allow for comparison between different datasets by standardizing values, making it easier to identify how unusual or typical a particular observation is within its distribution.
추천 영상:
가이드 코스
06:31
Z-Scores From Given Probability - TI-84 (CE) Calculator

Mean (μ)

The mean, often represented by the symbol μ (mu), is the average value of a dataset, calculated by summing all the data points and dividing by the number of points. It provides a central value around which the data tends to cluster. In the context of the question, the means for Best Actor and Best Supporting Actor ages are essential for calculating their respective z-scores.
추천 영상:
가이드 코스
04:52
Calculating the Mean

Standard Deviation (σ)

Standard deviation, denoted by σ (sigma), quantifies the amount of variation or dispersion in a dataset. A low standard deviation indicates that the data points tend to be close to the mean, while a high standard deviation suggests a wider spread of values. Understanding standard deviation is crucial for interpreting z-scores, as it is a key component in their calculation, reflecting the variability of ages among the award winners.
추천 영상:
가이드 코스
08:45
Calculating Standard Deviation
관련 실천
교과서 질문

Estimating Standard Deviation Both data sets shown in the stem-and-leaf plots have a mean of 165. One has a standard deviation of 16, and the other has a standard deviation of 24. By looking at the stem-and-leaf plots, which is which? Explain your reasoning.


129
views
교과서 질문

Finding a Percentile In Exercises 33–36, use the data set, which represents the ages of 30 executives.

43 57 65 47 57 41 56 53 61 54

56 50 66 56 50 61 47 40 50 43

54 41 48 45 28 35 38 43 42 44


Which ages are above the 75th percentile?

420
views
교과서 질문

In Exercises 13 and 14, find the range, mean, variance, and standard deviation of the population data set.


Drunk Driving The number of alcohol-impaired crash fatalities (in thousands) per year from 2010 through 2019 (Source: National Highway Traffic Safety Administration)

10.1 9.9 10.3 10.1 9.9 10.3 11.0 10.9 10.7 10.1

119
views
교과서 질문

What is the difference between class limits and class boundaries?

1018
views
교과서 질문

Graphing Data Sets In Exercises 17–32, organize the data using the indicated type of graph. Describe any patterns.


Nursing Use a stem-and-leaf plot to display the data, which represent the number of hours 24 nurses work per week. 

40 40 35 48 38 40 36 50 32 36 40 35

30 24 40 36 40 36 40 39 33 40 32 38

152
views
교과서 질문

Constructing a Frequency Distribution and a Relative Frequency Histogram In Exercises 37–40, construct a frequency distribution and a relative frequency histogram for the data set using five classes. Which class has the greatest relative frequency and which has the least relative frequency?

Taste Test

Data set: Ratings from 1 (lowest) to 10 (highest) provided by 36 people after taste-testing a new flavor of protein bar 2 6 9 2 9 9 6 10 5 8 7 6 5 10 1 4 9 3 4 5 3 6 5 2 4 9 2 9 3 3 6 5 1 9 4 2

261
views