


Ch. 2 - Descriptive Statistics
Larson - Elementary Statistics: Picturing the World 8th Edition
Larson8th EditionElementary Statistics: Picturing the WorldISBN: 9780137493470당신이 사용하는 게 아니라요?교과서 변경
2장, 문제 2.4.53b

Scaling Data Sample annual salaries (in thousands of dollars) for employees at a company are listed.
42   36   48   51   39   39   42
36   48   33   39   42   45   50
b. Each employee in the sample receives a 5% raise. Find the sample mean and the sample standard deviation for the revised data set.

검증된 단계별 안내
1
Step 1: Calculate the sample mean of the original data set. The formula for the sample mean is \( \bar{x} = \frac{\sum x_i}{n} \), where \( x_i \) represents each data point and \( n \) is the total number of data points. Add all the salaries together and divide by the total number of employees.
Step 2: Calculate the sample standard deviation of the original data set. Use the formula \( s = \sqrt{\frac{\sum (x_i - \bar{x})^2}{n-1}} \), where \( \bar{x} \) is the sample mean. Subtract the mean from each data point, square the result, sum all squared differences, divide by \( n-1 \), and take the square root.
Step 3: Apply the 5% raise to each salary in the data set. Multiply each salary by 1.05 (since a 5% increase is equivalent to multiplying by 1.05) to create the revised data set.
Step 4: Calculate the sample mean of the revised data set. Since multiplying each data point by a constant scales the mean by the same factor, multiply the original sample mean by 1.05 to find the new mean.
Step 5: Calculate the sample standard deviation of the revised data set. When each data point is multiplied by a constant, the standard deviation is also scaled by the same factor. Multiply the original standard deviation by 1.05 to find the new standard deviation.

비슷한 문제에 대한 검증된 영상 답변:

이 영상 해법은 위 문제에 도움이 된다고 튜터들이 추천한 것입니다.
영상 길이:
5m
도움이 되었나요?

주요 개념

질문에 올바르게 답하기 위해 반드시 이해해야 하는 핵심 개념들은 다음과 같습니다.

Sample Mean

The sample mean is the average of a set of values, calculated by summing all the values and dividing by the number of observations. In this context, it represents the average salary of employees before and after the 5% raise. Understanding how to compute the sample mean is essential for analyzing the overall salary distribution.
추천 영상:
05:11
Sampling Distribution of Sample Proportion

Sample Standard Deviation

The sample standard deviation measures the amount of variation or dispersion in a set of values. It indicates how much individual salaries deviate from the sample mean. Calculating the standard deviation is crucial for understanding the spread of salaries and how consistent or varied the salaries are among employees.
추천 영상:
08:45
Calculating Standard Deviation

Percentage Increase

A percentage increase quantifies how much a value has grown relative to its original amount. In this case, each employee's salary is increased by 5%, which requires adjusting the original salaries before recalculating the mean and standard deviation. Understanding percentage increases is vital for accurately interpreting changes in data sets.
추천 영상:
가이드 코스
04:36
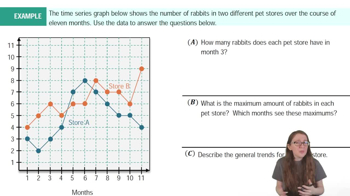
Time-Series Graphs Example 1
관련 실천
교과서 질문

Pearson’s Index of Skewness The English statistician Karl Pearson (1857–1936) introduced a formula for the skewness of a distribution.

P = 3 (x̄ - median) / s

Most distributions have an index of skewness between -3 and 3. When P > 0, the data are skewed right. When P < 0, the data are skewed left. When P = 0, the data are symmetric. Calculate the coefficient of skewness for each distribution. Describe the shape of each.


a. x̄ = 17, s = 2.3, median = 19

145
views
교과서 질문

Shifting Data Sample annual salaries (in thousands of dollars) for employees at a company are listed.

40   35   49   53   38   39   40

37   49   34   38   43   47   35


a. Find the sample mean and the sample standard deviation.

63
views
교과서 질문

Use the relative frequency histogram to

approximate the greatest and least relative frequencies.

179
views
교과서 질문

Life Spans of Fruit Flies The life spans of a species of fruit fly have a bell-shaped distribution, with a mean of 33 days and a standard deviation of 4 days.


b. The life spans of three randomly selected fruit flies are 29 days, 41 days, and 25 days. Using the Empirical Rule, find the percentile that corresponds to each life span.

137
views
교과서 질문

Drawing a Box-and-Whisker Plot In Exercises 15–18,

(b) draw a box-and-whisker plot that represents the data set.


2 7 1 3 1 2 8 9 9 2 5 4 7 3 7 5 4

2 3 5 9 5 6 3 9 3 4 9 8 8 2 3 9 5

99
views
교과서 질문

Extending Concepts


Alternative Formula You used SSₓ = Σ(x − x̄)² when calculating variance and standard deviation. An alternative formula that is sometimes more convenient for hand calculations is

SSₓ = Σ x² − (Σ x)² / n.

You can find the sample variance by dividing the sum of squares by n − 1 and the sample standard deviation by finding the square root of the sample variance.


b. Use the alternative formula to calculate the sample standard deviation for the data set in Exercise 15.

120
views