Ch. 2 - Descriptive Statistics
Larson - Elementary Statistics: Picturing the World 8th Edition
Larson8th EditionElementary Statistics: Picturing the WorldISBN: 9780137493470당신이 사용하는 게 아니라요?교과서 변경
2장, 문제 2.1.28b

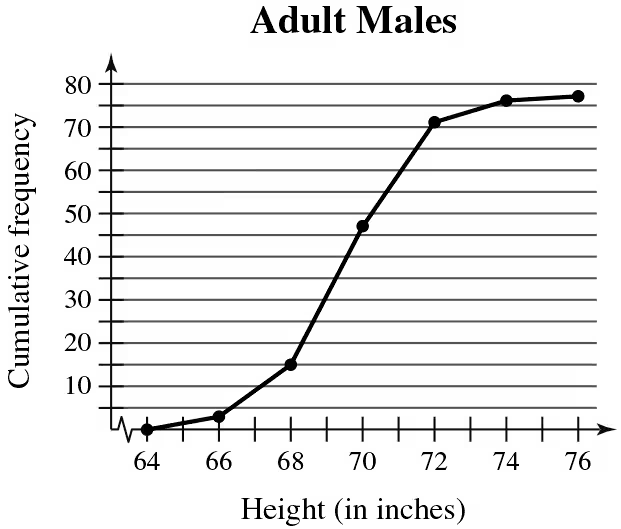
Use the ogive to approximate
the height for which the cumulative frequency is 15.
Graph showing cumulative frequency of adult males' heights, with data points plotted from 64 to 76 inches.

검증된 단계별 안내
1
Step 1: Understand the ogive graph. An ogive is a cumulative frequency graph that shows the cumulative frequency of data points up to a certain value. The x-axis represents the height (in inches), and the y-axis represents the cumulative frequency.
Step 2: Locate the cumulative frequency of 15 on the y-axis. This is the target value for which we need to approximate the corresponding height.
Step 3: Draw a horizontal line from the cumulative frequency value of 15 on the y-axis until it intersects the ogive curve.
Step 4: From the point of intersection, draw a vertical line down to the x-axis. This will give the approximate height corresponding to the cumulative frequency of 15.
Step 5: Read the value on the x-axis where the vertical line meets it. This is the approximate height for which the cumulative frequency is 15.

비슷한 문제에 대한 검증된 영상 답변:

이 영상 해법은 위 문제에 도움이 된다고 튜터들이 추천한 것입니다.
영상 길이:
1m
도움이 되었나요?

주요 개념

질문에 올바르게 답하기 위해 반드시 이해해야 하는 핵심 개념들은 다음과 같습니다.

Ogive

An ogive is a graphical representation of cumulative frequency. It is constructed by plotting the cumulative frequency against the upper boundaries of the class intervals. The resulting curve helps visualize how many observations fall below a particular value, making it easier to determine percentiles and other statistical measures.

Cumulative Frequency

Cumulative frequency is the running total of frequencies up to a certain point in a dataset. It shows the number of observations that fall below or at a specific value. This concept is crucial for understanding distributions and is often used in conjunction with ogives to analyze data trends and percentiles.
추천 영상:
가이드 코스
04:41
Creating Frequency Polygons

Interpolation

Interpolation is a statistical method used to estimate unknown values that fall within the range of a discrete set of known data points. In the context of the ogive, interpolation allows us to approximate the height corresponding to a specific cumulative frequency, such as 15, by finding the point on the curve that aligns with that frequency.
관련 실천
교과서 질문

Using and Interpreting Concepts


Using and Interpreting Concepts Finding Quartiles, Interquartile Range, and Outliers In Exercises 11 and 12,

(b) find the interquartile range


56 63 51 60 57 60 60 54 63 59 80 63 60 62 65

139
views

교과서 질문

Drawing a Box-and-Whisker Plot In Exercises 15–18,

(b) draw a box-and-whisker plot that represents the data set.


4 7 7 5 2 9 7 6 8 5 8 4 1 5 2 8 7 6 6 9

173
views
교과서 질문

Hourly Earnings Refer to the data set in Exercise 26 and the box-and-whisker plot you drew that represents the data set.


b. What percent of the employees made more than \$23.39 per hour?

86
views
교과서 질문

Mean Absolute Deviation Another useful measure of variation for a data set is the mean absolute deviation (MAD). It is calculated by the formula

MAD = Σ |x − x̄| / n.

b. Find the mean absolute deviation of the data set in Exercise 16. Compare your result with the sample standard deviation obtained in Exercise 16.

198
views
교과서 질문

Extending Concepts


Trimmed Mean To find the 10% trimmed mean of a data set, order the data, delete the lowest 10% of the entries and the highest 10% of the entries, and find the mean of the remaining entries.


b. Compare the four measures of central tendency, including the midrange.

93
views
교과서 질문

What Would You Do? You work at a bank and are asked to recommend the amount of cash to put in an ATM each day. You do not want to put in too much (which would cause security concerns) or too little (which may create customer irritation). The daily withdrawals (in hundreds of dollars) for 30 days are listed. 72 84 61 76 104 76 86 92 80 88 98 76 97 82 84 67 70 81 82 89 74 73 86 81 85 78 82 80 91 83

If you put \$9000 in the ATM each day, what percent of the days in a month should you expect to run out of cash? Explain.

119
views