

Ch. 3 - Probability
Larson - Elementary Statistics: Picturing the World 8th Edition
Larson8th EditionElementary Statistics: Picturing the WorldISBN: 9780137493470당신이 사용하는 게 아니라요?교과서 변경
3장, 문제 3.3.22d

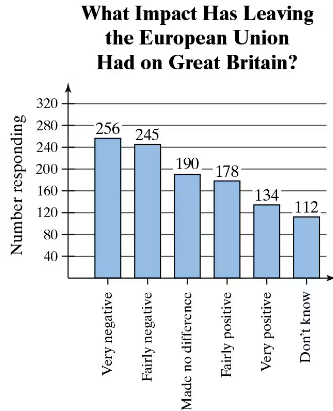
22. Brexit A survey asked 1115 British adults how Britain's decision to leave the European Union has impacted the country. The results are shown in the Pareto chart. Find the
probability of each event. (Adapted from Ipsos)
d. Randomly selecting a British adult who feels that the move has had a fairly positive or very positive impact on Great Britain
Bar chart showing survey results on the impact of leaving the EU on Great Britain, with responses ranging from very negative to don't know.

검증된 단계별 안내
1
Step 1: Identify the total number of respondents from the survey, which is given as 1115 British adults.
Step 2: Locate the number of respondents who feel the move has had a 'fairly positive' impact (178) and a 'very positive' impact (134) from the Pareto chart.
Step 3: Add the number of respondents for 'fairly positive' and 'very positive' impacts to find the total number of respondents who feel positively about the move. This is calculated as 178 + 134.
Step 4: Divide the total number of respondents who feel positively (from Step 3) by the total number of respondents (1115) to calculate the probability of randomly selecting a British adult who feels the move has had a fairly positive or very positive impact.
Step 5: Express the probability as a fraction, decimal, or percentage, depending on the context or requirement of the problem.

비슷한 문제에 대한 검증된 영상 답변:

이 영상 해법은 위 문제에 도움이 된다고 튜터들이 추천한 것입니다.
영상 길이:
3m
도움이 되었나요?

주요 개념

질문에 올바르게 답하기 위해 반드시 이해해야 하는 핵심 개념들은 다음과 같습니다.

Probability

Probability is a measure of the likelihood that a particular event will occur, expressed as a number between 0 and 1. In this context, it involves calculating the proportion of respondents who feel a certain way about Brexit's impact, relative to the total number of surveyed individuals. For example, if 134 out of 1115 respondents feel that the impact was 'very positive,' the probability of randomly selecting someone with that opinion can be calculated as 134/1115.
추천 영상:
가이드 코스
5:37
Introduction to Probability

Pareto Chart

A Pareto chart is a type of bar graph that represents the frequency of different categories in descending order. It is used to highlight the most significant factors in a dataset. In this case, the chart displays the responses of British adults regarding the impact of Brexit, allowing for a quick visual assessment of which opinions are most prevalent, such as 'very negative' and 'fairly negative' being the highest.
추천 영상:
가이드 코스
04:52
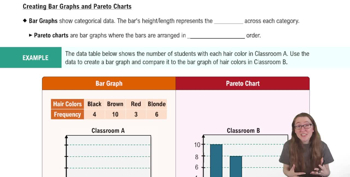
Creating Bar Graphs and Pareto Charts

Categorical Data

Categorical data refers to data that can be divided into distinct categories, which can be nominal or ordinal. In this survey, responses about Brexit's impact are categorical, as they represent different opinions (e.g., 'very negative,' 'fairly positive'). Understanding categorical data is essential for analyzing survey results, as it informs how to interpret and visualize the data effectively.
추천 영상:
가이드 코스
4:01
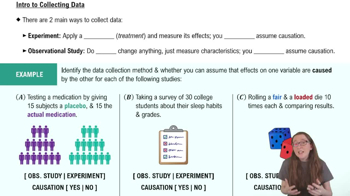
Introduction to Collecting Data
관련 실천
교과서 질문

50. Investment Committee A company has 200 employees, consisting of 144 women and 56 men. The company wants to select five employees to serve as an investment committee.

d. Explain how the company can select a representative sample of the male and female population of employees.

71
views
교과서 질문

Using the Multiplication Rule In Exercises 19-32, use the Multiplication Rule.

25. Best President In a sample of 1500 adult U.S. citizens, 270 said that Barack Obama was the best president in U.S. history. Two adult U.S. citizens are selected at random.

(Adapted from YouGov)

d. Which of the events can be considered unusual? Explain.

99
views
교과서 질문

26. Eye Survey The table shows the results of a survey that asked 3203 people whether they wore contacts or glasses. A person is selected at random from the sample. Find the probability of each event.

d. The person is male or does not wear glasses.

" style="max-width: 100%; white-space-collapse: preserve;" width="480">

83
views
교과서 질문

Using the Multiplication Rule In Exercises 19-32, use the Multiplication Rule.

27. Blood Types The probability that a person of Asian descent in the United States has type O+ blood is 39%. At random, six people of Asian descent in the United States are selected. (Source: American National Red Cross)

c. Find the probability that at least one of the six has type O+ blood.

74
views
교과서 질문

Politics The responses of 1500 U.S. adults to a survey that asked them to state their own political viewpoints are shown in the Pareto chart. Find the probability of each event.(Adapted from YouGov)

d. Randomly selecting a person from the sample who is either unsure or moderate


71
views
교과서 질문

Mental Health A survey asks 4805 parents the severity of the mental issues they experienced from the coronavirus pandemic. The results are shown in the table. A parent is randomly selected from the sample. Find the probability of each event. (Adapted from Kaiser Family Foundation)

" style="" width="345">

c. The parent did not have major mental health issues or is a mother.

104
views