Ch. 3 - Probability
Larson - Elementary Statistics: Picturing the World 8th Edition
Larson8th EditionElementary Statistics: Picturing the WorldISBN: 9780137493470당신이 사용하는 게 아니라요?교과서 변경
3장, 문제 3.3.20a

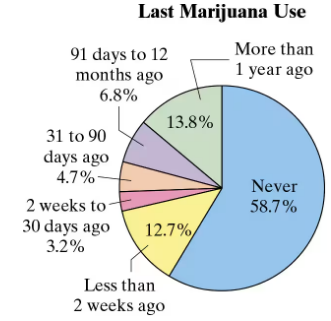
Marijuana Use The percent distribution of the last marijuana use (either medical or nonmedical) for a sample of 13,373 college students is shown in the pie chart. Find the
probability of each event. (Source: American College Health Association)
a. Randomly selecting a student who never used marijuana

검증된 단계별 안내
1
Step 1: Understand the problem. The goal is to find the probability of randomly selecting a student who has never used marijuana. The pie chart provides the percent distribution of marijuana use among college students.
Step 2: Identify the relevant data from the pie chart. The section labeled 'Never' corresponds to students who have never used marijuana, and its percentage is 58.7%.
Step 3: Recall that probability is calculated as the proportion of the desired outcome relative to the total population. In this case, the probability of selecting a student who has never used marijuana is equal to the percentage of students in the 'Never' category divided by 100.
Step 4: Convert the percentage into a decimal form for probability calculation. To do this, divide 58.7 by 100. This gives the probability in decimal form.
Step 5: Interpret the result. The probability represents the likelihood of randomly selecting a student who has never used marijuana from the sample of 13,373 college students.

비슷한 문제에 대한 검증된 영상 답변:

이 영상 해법은 위 문제에 도움이 된다고 튜터들이 추천한 것입니다.
영상 길이:
1m
도움이 되었나요?

주요 개념

질문에 올바르게 답하기 위해 반드시 이해해야 하는 핵심 개념들은 다음과 같습니다.

Probability

Probability is a measure of the likelihood that a particular event will occur, expressed as a number between 0 and 1. In this context, it refers to the chance of randomly selecting a student from the sample who has never used marijuana. The probability can be calculated by dividing the number of students in a specific category by the total number of students surveyed.
추천 영상:
가이드 코스
5:37
Introduction to Probability

Percent Distribution

Percent distribution is a way of representing data in terms of percentages, showing how a total is divided among different categories. In the pie chart provided, each segment represents the percentage of students based on their last marijuana use, allowing for a visual comparison of the different categories, including those who have never used marijuana.
추천 영상:
가이드 코스
06:38
Intro to Frequency Distributions

Sample Size

Sample size refers to the number of observations or data points collected in a study. In this case, the sample size is 13,373 college students, which is significant for ensuring that the results are reliable and can be generalized to a larger population. A larger sample size typically leads to more accurate estimates of probabilities and distributions.
추천 영상:
가이드 코스
05:11
Sampling Distribution of Sample Proportion
관련 실천
교과서 질문

18. Rolling a Die You roll a die. Find the probability of each event.

b. Rolling a 2 or an odd number

101
views

교과서 질문

"Using the Multiplication Rule In Exercises 19-32, use the Multiplication Rule.

28. Blood Types The probability that a Latinx American person in the United States has type A+ blood is 29%. Four Latinx American people in the United States are selected at random. (Source: American National Red Cross)

a. Find the probability that all four have type A+ blood."

85
views
교과서 질문

Using the Multiplication Rule In Exercises 19-32, use the Multiplication Rule.

24. Knowing a Person Who Was Murdered In a sample of 11,771 children ages 2 to 17, 8% have lost a friend or relative to murder. Four children are selected at random. (Adapted from University of New Hampshire)

a. Find the probability that all four have lost a friend or relative to murder.

113
views
교과서 질문

"Using the Multiplication Rule In Exercises 19-32, use the Multiplication Rule.

26. Worst President In a sample of 1500 adult U.S. citizens, 690 said that Donald Trump was the worst president in U.S. history. Three adult U.S. citizens are selected at random.

(Adapted from YouGov)

b. Find the probability that none of the three adult U.S. citizens say that Donald Trump was the worst president in U.S. history."

40
views
교과서 질문

Finding Conditional Probabilities In Exercises 7 and 8, use the table to find each conditional probability.

7. Business Degrees The table shows the numbers of male and female students in the United States who received bachelor's degrees in business and nonbusiness fields in a recent year. (Source: National Center for Educational Statistics)

b. Find the probability that a randomly selected bachelor's degree-earning student received a business degree, given that the student is female.

107
views
교과서 질문

Using the Multiplication Rule In Exercises 19-32, use the Multiplication Rule.

29. In Vitro Fertilization In a recent year, about 1.9% of all infants born in the U.S. were conceived through assisted reproductive technology (ART). Of the ART deliveries, about 26.4% resulted in multiple births. (Source: Morbidity and Mortality Weekly Report)

a. Find the probability that a randomly selected infant was conceived through ART and was part of a multiple birth.

88
views