Ch. 4 - Discrete Probability Distributions
Larson - Elementary Statistics: Picturing the World 8th Edition
Larson8th EditionElementary Statistics: Picturing the WorldISBN: 9780137493470당신이 사용하는 게 아니라요?교과서 변경
4장, 문제 4.1.19

Constructing and Graphing Discrete Probability Distributions In Exercises 19 and 20, (a) construct a probability distribution, and (b) graph the probability distribution using a histogram and describe its shape.


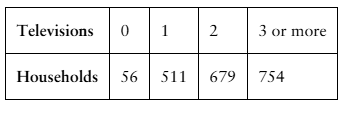
Televisions The number of high-definition (HD) televisions per household in a small town
Table showing the number of households with 0, 1, 2, and 3 or more televisions in a small town.

검증된 단계별 안내
1
Step 1: Calculate the total number of households by summing the values in the 'Households' row. This will be used to determine the probabilities for the probability distribution.
Step 2: For each category of televisions (0, 1, 2, 3 or more), calculate the probability by dividing the number of households in that category by the total number of households. Use the formula: P(X = x) = (Number of households for x televisions) / (Total number of households).
Step 3: Construct the probability distribution table. The table should include two columns: one for the number of televisions (0, 1, 2, 3 or more) and one for the corresponding probabilities calculated in Step 2.
Step 4: Create a histogram to graph the probability distribution. On the x-axis, plot the number of televisions (0, 1, 2, 3 or more), and on the y-axis, plot the probabilities. Ensure the bars are proportional to the probabilities.
Step 5: Analyze the shape of the histogram. Determine whether the distribution is symmetric, skewed left, skewed right, or uniform based on the heights of the bars.

비슷한 문제에 대한 검증된 영상 답변:

이 영상 해법은 위 문제에 도움이 된다고 튜터들이 추천한 것입니다.
영상 길이:
4m
도움이 되었나요?

주요 개념

질문에 올바르게 답하기 위해 반드시 이해해야 하는 핵심 개념들은 다음과 같습니다.

Discrete Probability Distribution

A discrete probability distribution describes the likelihood of each possible outcome in a discrete sample space. In this context, it represents the number of high-definition televisions per household, where each outcome (0, 1, 2, or 3 or more televisions) has a corresponding probability calculated by dividing the number of households with that outcome by the total number of households.
추천 영상:
가이드 코스
04:48
Variance & Standard Deviation of Discrete Random Variables

Histogram

A histogram is a graphical representation of the distribution of numerical data, where the data is divided into bins or intervals. In this case, the histogram will display the frequency of households for each category of televisions, allowing for a visual interpretation of the probability distribution and helping to identify patterns or trends in the data.
추천 영상:
가이드 코스
05:54
Intro to Histograms

Shape of the Distribution

The shape of a probability distribution provides insights into the data's characteristics, such as symmetry, skewness, and modality. For the given data on televisions per household, analyzing the histogram's shape will help determine whether the distribution is uniform, normal, skewed, or has multiple peaks, which can inform conclusions about household television ownership in the small town.
추천 영상:
05:11
Sampling Distribution of Sample Proportion
관련 실천
교과서 질문

In Exercises 1–4, find the indicated probability using the geometric distribution.

Find P(3) when p = 0.65

124
views

교과서 질문

Mean, Variance, and Standard Deviation In Exercises 11–14, find the mean, variance, and standard deviation of the binomial distribution with the given values of n and p.

n = 316, p = 0.82

94
views
교과서 질문

In your own words, describe the difference between the value of x in a binomial distribution and in the Poisson distribution.

143
views
교과서 질문

Identifying Probability Distributions In Exercises 27 and 28, determine whether the distribution is a probability distribution. If it is not a probability distribution, explain why.

195
views
교과서 질문

Finding an Expected Value In Exercises 37 and 38, find the expected value E(x) to the player for one play of the game. If x is the gain to a player in a game of chance, then E(x) is usually negative. This value gives the average amount per game the player can expect to lose.


In American roulette, the wheel has the 38 numbers, 00, 0, 1, 2, . . ., 34, 35, and 36, marked on equally spaced slots. If a player bets \$1 on a number and wins, then the player keeps the dollar and receives an additional \$35. Otherwise, the dollar is lost.

113
views
교과서 질문

Graphical Analysis In Exercises 3–5, the histogram represents a binomial distribution with five trials. Match the histogram with the appropriate probability of success p. Explain your reasoning.

a. p = 0.25

b. p = 0.50

c. p = 0.75

118
views