Ch. 4 - Discrete Probability Distributions
Larson - Elementary Statistics: Picturing the World 8th Edition
Larson8th EditionElementary Statistics: Picturing the WorldISBN: 9780137493470당신이 사용하는 게 아니라요?교과서 변경
4장, 문제 4.R.9

In Exercises 9 and 10, find the expected net gain to the player for one play of the game.


It costs \(25 to bet on a horse race. The horse has a 1/8 chance of winning and a 1/4 chance of placing second or third. You win \)125 if the horse wins and receive your money back if the horse places second or third.

검증된 단계별 안내
1
Step 1: Define the random variable X as the net gain for the player. The possible outcomes for X are: (1) winning the race, (2) placing second or third, and (3) losing the race.
Step 2: Calculate the net gain for each outcome. If the horse wins, the net gain is \(125 (winnings) - \)25 (cost of bet) = \$100. If the horse places second or third, the net gain is \(25 (money back) - \)25 (cost of bet) = \(0. If the horse loses, the net gain is -\)25 (cost of bet).
Step 3: Assign probabilities to each outcome. The probability of winning is 1/8, the probability of placing second or third is 1/4, and the probability of losing is 1 - (1/8 + 1/4) = 5/8.
Step 4: Use the formula for expected value: E(X) = Σ [P(x) * x], where P(x) is the probability of each outcome and x is the corresponding net gain. Substitute the values: E(X) = (1/8 * 100) + (1/4 * 0) + (5/8 * -25).
Step 5: Simplify the expression to calculate the expected value. This will give the expected net gain for one play of the game.

비슷한 문제에 대한 검증된 영상 답변:

이 영상 해법은 위 문제에 도움이 된다고 튜터들이 추천한 것입니다.
영상 길이:
4m
도움이 되었나요?

주요 개념

질문에 올바르게 답하기 위해 반드시 이해해야 하는 핵심 개념들은 다음과 같습니다.

Expected Value

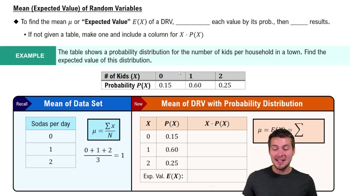
Expected value is a fundamental concept in probability and statistics that represents the average outcome of a random event when repeated many times. It is calculated by multiplying each possible outcome by its probability and summing these products. In the context of gambling, it helps determine the average net gain or loss per bet, guiding players in making informed decisions.
추천 영상:
가이드 코스
04:14
Expected Value (Mean) of Random Variables

Probability

Probability quantifies the likelihood of an event occurring, expressed as a number between 0 and 1. In this scenario, the horse's chances of winning (1/8) and placing (1/4) are essential for calculating the expected net gain. Understanding these probabilities allows players to assess their potential returns based on the outcomes of the race.
추천 영상:
가이드 코스
5:37
Introduction to Probability

Net Gain

Net gain refers to the total profit or loss from a bet after accounting for the initial investment. In this case, it involves calculating the winnings from the horse race and subtracting the cost of the bet. By determining the net gain for each possible outcome, players can evaluate the overall expected net gain from a single play of the game.
추천 영상:
가이드 코스
02:59
The Binomial Experiment Example 2
관련 실천
교과서 질문

In Exercises 7 and 8, (a) find the mean, variance, and standard deviation of the probability distribution, and (b) interpret the results.


The number of cell phones per household in a small town

99
views

교과서 질문

In Exercises 17 and 18, (a) construct a binomial distribution, (b) graph the binomial distribution using a histogram and describe its shape, and (c) identify any values of the random variable x that you would consider unusual. Explain your reasoning.

Seventy-two percent of U.S adults have read a book in any format in the past year. You randomly select five U.S adults and ask them whether they have read a book in any format in the past year. The random variable represents the number of adults who have read a book in any format in the past year. (Source: Pew Research)

131
views
교과서 질문

In Exercises 19 and 20, find the mean, variance, and standard deviation of the binomial distribution for the given random variable. Interpret the results and determine any unusual values.

About 13% of U.S. drivers are uninsured. You randomly select eight U.S. drivers and ask them whether they are uninsured. The random variable represents the number who are uninsured. (Source: Insurance Research Council)

145
views
교과서 질문

In Exercises 21–26, find the indicated probabilities using the geometric distribution, the Poisson distribution, or the binomial distribution. Then determine whether the events are unusual. If convenient, use a table or technology to find the probabilities.

Fourteen percent of noninstitutionalized U.S. adults smoke cigarettes. After randomly selecting ten noninstitutionalized U.S. adults, you ask them whether they smoke cigarettes. Find the probability that the first adult who smokes cigarettes is (c) not one of the first six persons selected.

77
views
교과서 질문

In Exercises 21–26, find the indicated probabilities using the geometric distribution, the Poisson distribution, or the binomial distribution. Then determine whether the events are unusual. If convenient, use a table or technology to find the probabilities

Thirty-six percent of Americans think there is still a need for the practice of changing their clocks for Daylight Savings Time. You randomly select seven Americans. Find the probability that the number who say there is still a need for changing their clocks for Daylight Savings Time is (b) less than two

98
views
교과서 질문

In Exercises 3 and 4, (a) construct a probability distribution, and (b) graph the probability distribution using a histogram and describe its shape.


The number of hours students in a college class slept the previous night

156
views