


Ch. 5 - Normal Probability Distributions
Larson - Elementary Statistics: Picturing the World 8th Edition
Larson8th EditionElementary Statistics: Picturing the WorldISBN: 9780137493470당신이 사용하는 게 아니라요?교과서 변경
5장, 문제 5.1.3

Describe the inflection points on the graph of a normal distribution. At what x-values are the inflection points located?

검증된 단계별 안내
1
Understand that an inflection point on a graph is where the curvature changes from concave up to concave down or vice versa. For a normal distribution, this occurs where the second derivative of the probability density function (PDF) equals zero.
Recall the formula for the normal distribution's PDF: \( f(x) = \frac{1}{\sigma \sqrt{2\pi}} e^{-\frac{(x-\mu)^2}{2\sigma^2}} \), where \( \mu \) is the mean and \( \sigma \) is the standard deviation.
To find the inflection points, calculate the second derivative of \( f(x) \). Start by finding the first derivative of \( f(x) \), then differentiate it again to obtain the second derivative.
Set the second derivative equal to zero and solve for \( x \). This will give the x-values where the curvature changes. For a normal distribution, the inflection points are located at \( x = \mu - \sigma \) and \( x = \mu + \sigma \).
Interpret the result: The inflection points divide the graph into regions of concave up and concave down. These points are one standard deviation away from the mean on either side, and they mark the steepest ascent and descent of the bell curve.

비슷한 문제에 대한 검증된 영상 답변:

이 영상 해법은 위 문제에 도움이 된다고 튜터들이 추천한 것입니다.
영상 길이:
2m
도움이 되었나요?

주요 개념

질문에 올바르게 답하기 위해 반드시 이해해야 하는 핵심 개념들은 다음과 같습니다.

Normal Distribution

The normal distribution is a continuous probability distribution characterized by its bell-shaped curve, symmetric about the mean. It is defined by two parameters: the mean (average) and the standard deviation (spread). The properties of the normal distribution make it fundamental in statistics, as many statistical tests assume normality in the data.
추천 영상:
06:23
Using the Normal Distribution to Approximate Binomial Probabilities

Inflection Points

Inflection points on a graph are points where the curvature changes direction, indicating a transition from concave up to concave down or vice versa. In the context of the normal distribution, the inflection points occur at one standard deviation away from the mean, marking the points where the slope of the curve changes and the rate of increase or decrease of the probability density function alters.
추천 영상:
가이드 코스
05:14
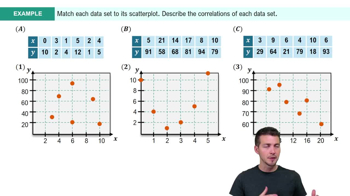
Scatterplots & Intro to Correlation Example 1

Standard Deviation

Standard deviation is a measure of the amount of variation or dispersion in a set of values. In a normal distribution, it determines the width of the curve; a smaller standard deviation results in a steeper curve, while a larger one produces a flatter curve. The inflection points are located at the mean plus or minus one standard deviation, specifically at x = μ ± σ, where μ is the mean and σ is the standard deviation.
추천 영상:
가이드 코스
08:45
Calculating Standard Deviation