Ch. 5 - Normal Probability Distributions
Larson - Elementary Statistics: Picturing the World 8th Edition
Larson8th EditionElementary Statistics: Picturing the WorldISBN: 9780137493470당신이 사용하는 게 아니라요?교과서 변경
5장, 문제 5.2.15

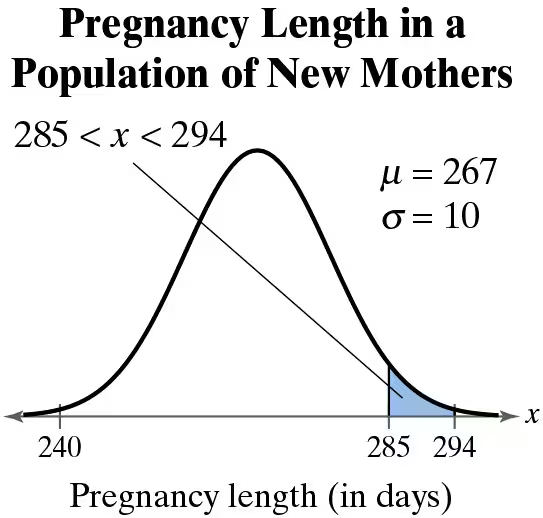
Graphical Analysis In Exercises 13–16, a member is selected at random from the population represented by the graph. Find the probability that the member selected at random is from the shaded region of the graph. Assume the variable x is normally distributed.


<IMAGE>

검증된 단계별 안내
1
Step 1: Identify the key parameters of the normal distribution from the graph. The mean (μ) is given as 267 days, and the standard deviation (σ) is 10 days. The shaded region corresponds to the range 285 < x < 294.
Step 2: Convert the given range (285 < x < 294) into z-scores using the formula: z=x-μσ. For x = 285 and x = 294, calculate the respective z-scores.
Step 3: Use a standard normal distribution table or software to find the cumulative probabilities corresponding to the calculated z-scores. The cumulative probability for z = (285 - 267)/10 and z = (294 - 267)/10 will be determined.
Step 4: Subtract the cumulative probability at z = 285 from the cumulative probability at z = 294 to find the probability of the shaded region. This gives the area under the curve between these two z-scores.
Step 5: Interpret the result as the probability that a randomly selected member of the population has a pregnancy length between 285 and 294 days.

비슷한 문제에 대한 검증된 영상 답변:

이 영상 해법은 위 문제에 도움이 된다고 튜터들이 추천한 것입니다.
영상 길이:
4m
도움이 되었나요?

주요 개념

질문에 올바르게 답하기 위해 반드시 이해해야 하는 핵심 개념들은 다음과 같습니다.

Normal Distribution

Normal distribution is a continuous probability distribution characterized by its bell-shaped curve, defined by its mean (μ) and standard deviation (σ). In this context, the pregnancy lengths are normally distributed, meaning most values cluster around the mean, with fewer values appearing as you move away from the mean in either direction.
추천 영상:
06:23
Using the Normal Distribution to Approximate Binomial Probabilities

Probability

Probability quantifies the likelihood of an event occurring, expressed as a number between 0 and 1. In this scenario, we are interested in finding the probability that a randomly selected pregnancy length falls within a specific range (285 to 294 days), which can be calculated using the area under the normal distribution curve corresponding to that interval.
추천 영상:
5:37
Introduction to Probability

Z-scores

A Z-score indicates how many standard deviations an element is from the mean of a distribution. It is calculated using the formula Z = (X - μ) / σ. In this case, Z-scores can be used to standardize the values of 285 and 294, allowing us to find the corresponding probabilities from the standard normal distribution table.
추천 영상:
가이드 코스
06:31
Z-Scores From Given Probability - TI-84 (CE) Calculator
관련 실천
교과서 질문

In Exercises 5–8, match the binomial probability statement with its corresponding normal distribution probability statement (a)–(d) after a continuity correction.

P(x≥109)


a. P(x>109.5)

b. P(x<108.5)

c. P(x<109.5)

d. P(x>108.5)

94
views

교과서 질문

Finding a z-Score Given an Area In Exercises 23–30, find the indicated z-score.


Find the z-score that has 2.275% of the distribution’s area to its left.

109
views
교과서 질문

In Exercises 21–24, a control chart is shown. Each chart has horizontal lines drawn at the mean mu, at mu ±2sigma, and at mu±3sigma. Determine whether the process shown is in control or out of control. Explain.


An engine part has been designed to have a diameter of 55 millimeters. The standard deviation of the process is 0.001 millimeter.


55
views
교과서 질문

Using and Interpreting Concepts

Finding Area In Exercises 17–22, find the area of the shaded region under the standard normal curve. If convenient, use technology to find the area.

81
views
교과서 질문

Finding a z-Score In Exercises 1–16, use the Standard Normal Table or technology to find the z-score that corresponds to the cumulative area or percentile.


P33

106
views
교과서 질문

True or False? In Exercises 5–8, determine whether the statement is true or false. If it is false, rewrite it as a true statement.


If the sample size is at least 30, then you can use z-scores to determine the probability that a sample mean falls in a given interval of the sampling distribution.

104
views