
교과서 질문
Finding Area In Exercises 23–36, find the indicated area under the standard normal curve. If convenient, use technology to find the area.
To the left of z= -1.28 and to the right of z= 1.28
83
views


 검증된 단계별 안내

 09:47
09:47
 08:50
08:50 06:31
06:31Finding Area In Exercises 23–36, find the indicated area under the standard normal curve. If convenient, use technology to find the area.
To the left of z= -1.28 and to the right of z= 1.28
Which Is More Likely? Assume that the fertility rates in Exercise 32 are normally distributed. Are you more likely to randomly select a state with a fertility rate of less than 65 or to randomly select a sample of 15 states in which the mean of the state fertility rates is less than 65? Explain.
Finding Probabilities In Exercises 15–18, the population mean and standard deviation are given. Find the indicated probability and determine whether the given sample mean would be considered unusual.
For a random sample of n=45, find the probability of a sample mean being greater than 551 when mu=550 and sigma=3.7.
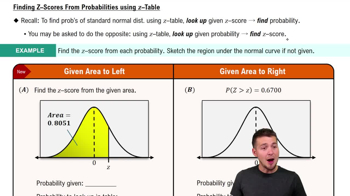
Finding a z-Score In Exercises 1–16, use the Standard Normal Table or technology to find the z-score that corresponds to the cumulative area or percentile.
0.6736
In Exercises 1–4, a population has a mean mu and a standard deviation sigma. Find the mean and standard deviation of the sampling distribution of sample means with sample size n.
Mu = 45, sigma =15, n = 100
In Exercises 9–14, write the binomial probability in words. Then, use a continuity correction to convert the binomial probability to a normal distribution probability.
P(x > 65)