
교과서 질문
The data set represents the amounts of time (in minutes) spent checking email for a random sample of employees at a company.
c. Repeat part (b), assuming σ = 3.5 minutes. Compare the results.
57
views

 검증된 단계별 안내

 04:48
04:48
 06:21
06:21 08:45
08:45The data set represents the amounts of time (in minutes) spent checking email for a random sample of employees at a company.
c. Repeat part (b), assuming σ = 3.5 minutes. Compare the results.
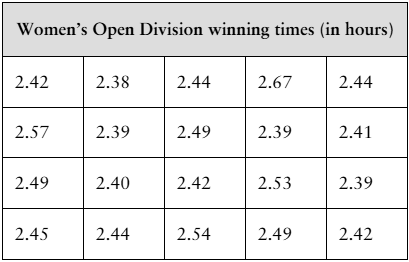
[APPLET] The winning times (in hours) for a sample of 20 randomly selected Boston Marathon Women’s Open Division champions from 1980 to 2019 are shown in the table at the left. Assume the population standard deviation is 0.068 hour. (Source: Boston Athletic Association)
a. Find the point estimate of the population mean.
[APPLET] The winning times (in hours) for a sample of 20 randomly selected Boston Marathon Women’s Open Division champions from 1980 to 2019 are shown in the table at the left. Assume the population standard deviation is 0.068 hour. (Source: Boston Athletic Association)
b. Find the margin of error for a 95% confidence level.
You wish to estimate the mean winning time for Boston Marathon Women’s Open Division champions. The estimate must be within 2 minutes of the population mean. Determine the minimum sample size required to construct a 99% confidence interval for the population mean. Use the population standard deviation from Exercise 1.
In a random sample of 12 senior-level civil engineers, the mean annual earnings were \$133,326 and the standard deviation was \$36,729. Assume the annual earnings are normally distributed and construct a 95% confidence interval for the population mean annual earnings for senior-level civil engineers. Interpret the results. (Adapted from Salary.com)
You research the salaries of senior-level civil engineers and find that the population mean is \$131,935. In Exercise 4, does the t-value fall between -t0.95 and t0.95?