


Ch. 6 - Confidence Intervals
Larson - Elementary Statistics: Picturing the World 8th Edition
Larson8th EditionElementary Statistics: Picturing the WorldISBN: 9780137493470당신이 사용하는 게 아니라요?교과서 변경
6장, 문제 6.3.19a

Fast Food You wish to estimate, with 90% confidence, the population proportion of U.S. families who eat fast food at least once per week. Your estimate must be accurate within 3% of the population proportion.
a. No preliminary estimate is available. Find the minimum sample size needed.

검증된 단계별 안내
1
Step 1: Recall the formula for determining the minimum sample size for estimating a population proportion when no preliminary estimate is available: n = (Z^2 * 0.25) / E^2. Here, Z is the critical value corresponding to the desired confidence level, and E is the margin of error.
Step 2: Identify the given values. The confidence level is 90%, so the critical value Z can be found using a Z-table or standard normal distribution. For a 90% confidence level, Z ≈ 1.645. The margin of error E is given as 0.03 (3%).
Step 3: Substitute the values into the formula. Use Z = 1.645, E = 0.03, and the maximum variability for the population proportion (p = 0.5, q = 1 - p = 0.5, so p * q = 0.25). The formula becomes n = (1.645^2 * 0.25) / 0.03^2.
Step 4: Simplify the numerator by squaring the Z-value and multiplying it by 0.25. Then, simplify the denominator by squaring the margin of error (E).
Step 5: Divide the simplified numerator by the simplified denominator to calculate the minimum sample size. Always round up to the nearest whole number, as sample size must be an integer.

비슷한 문제에 대한 검증된 영상 답변:

이 영상 해법은 위 문제에 도움이 된다고 튜터들이 추천한 것입니다.
영상 길이:
2m

주요 개념

질문에 올바르게 답하기 위해 반드시 이해해야 하는 핵심 개념들은 다음과 같습니다.

Population Proportion

The population proportion refers to the fraction of a population that exhibits a certain characteristic, in this case, U.S. families who eat fast food at least once per week. It is denoted by 'p' and is crucial for estimating how widespread a behavior or opinion is within a defined group.
추천 영상:
가이드 코스
05:45
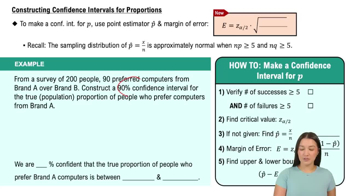
Constructing Confidence Intervals for Proportions

Sample Size Calculation

Sample size calculation is a statistical method used to determine the number of observations or replicates needed to achieve a desired level of precision in estimates. In this scenario, it involves using the desired confidence level (90%) and margin of error (3%) to ensure that the sample accurately reflects the population proportion.
추천 영상:
가이드 코스
05:11
Sampling Distribution of Sample Proportion

Confidence Interval

A confidence interval is a range of values, derived from sample statistics, that is likely to contain the population parameter with a specified level of confidence. For this question, a 90% confidence interval means that if the same sampling method were repeated multiple times, 90% of the intervals would contain the true population proportion.
추천 영상:
가이드 코스
06:33
Introduction to Confidence Intervals
관련 실천
교과서 질문

Constructing Confidence Intervals In Exercises 13–24, assume the sample is from a normally distributed population and construct the indicated confidence intervals for (a) the population variance σ^2. Interpret the results.

Drive-Thru Times The times (in seconds) spent by a random sample of 28 customers in the drive-thru of a fast-food restaurant have a sample standard deviation of 56.1. Use a 98% level of confidence.

69
views
교과서 질문

Since 1935, the Gallup Organization has conducted public opinion polls in the United States and around the world. The table shows the results of Gallup’s World Affairs Poll of 2021, in which 1021 U.S. adults were polled. The remaining percentages not shown in the results are adults who were not sure.

[IMAGE]

Find the minimum sample size needed to estimate, with 95% confidence, the population proportion of adults who feel that China’s economic power is a critical or an important economic threat to the United States. Your estimate must be accurate within 2% of the population proportion.

42
views
교과서 질문

Since 1935, the Gallup Organization has conducted public opinion polls in the United States and around the world. The table shows the results of Gallup’s World Affairs Poll of 2021, in which 1021 U.S. adults were polled. The remaining percentages not shown in the results are adults who were not sure.

b. What was the greatest value you obtained for p^?

66
views
교과서 질문

Senate Filibuster You wish to estimate, with 99% confidence, the population proportion of U.S. adults who disapprove of the U.S Senate’s use of the filibuster. Your estimate must be accurate within 2% of the population proportion.

a. No preliminary estimate is available. Find the minimum sample size needed.

47
views
교과서 질문

Constructing Confidence Intervals In Exercises 13–24, assume the sample is from a normally distributed population and construct the indicated confidence intervals for (a) the population variance σ^2. Interpret the results.

Annual Precipitation The annual precipitation amounts (in inches) of a random sample of 61 years for Chicago, Illinois, have a sample standard deviation of 6.46. Use a 98% level of confidence. (Source: National Oceanic and Atmospheric Administration)

48
views
교과서 질문

Since 1935, the Gallup Organization has conducted public opinion polls in the United States and around the world. The table shows the results of Gallup’s World Affairs Poll of 2021, in which 1021 U.S. adults were polled. The remaining percentages not shown in the results are adults who were not sure.

Use technology to find a 95% confidence interval for the population proportion of adults who

a. view foreign trade as an economic opportunity.

36
views